Need Full Specifications?
Download our 2025 Product Catalog for detailed drawings and technical parameters of all switchgear components.
Get CatalogDownload our 2025 Product Catalog for detailed drawings and technical parameters of all switchgear components.
Get CatalogDownload our 2025 Product Catalog for detailed drawings and technical parameters of all switchgear components.
Get Catalog
Cast epoxy resin serves as the backbone of solid insulation in medium-voltage switchgear. It encapsulates vacuum circuit breaker poles, supports bus conductors, and forms the bushings that transition power between compartments. When epoxy fails, the equipment fails with it—often during peak demand when thermal and electrical stresses combine.
This field guide provides systematic inspection methods for detecting cracks, voids, and tracking in epoxy components rated 12 kV through 40.5 kV. The techniques apply to incoming inspection, commissioning verification, and periodic in-service assessment.
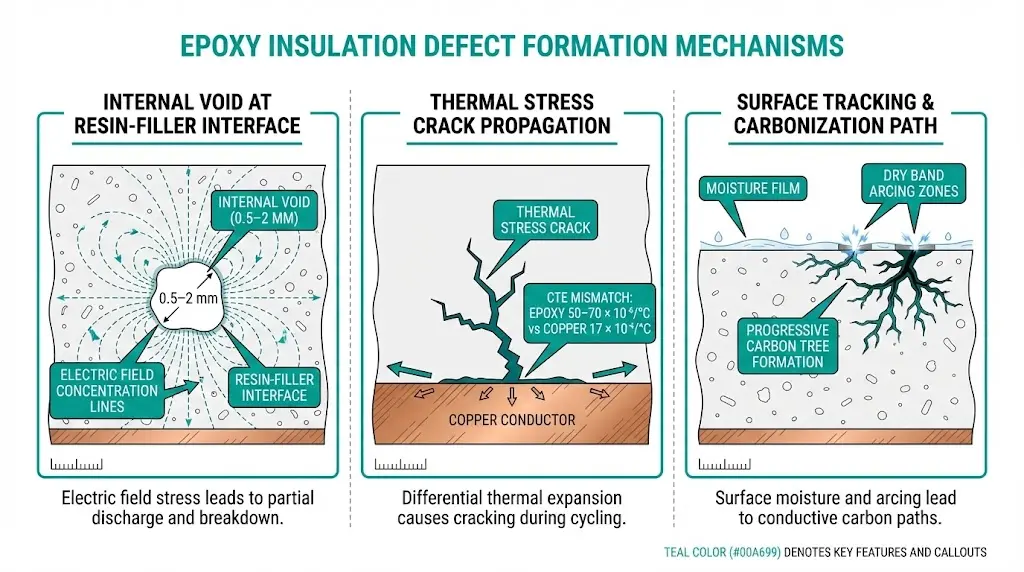
Understanding defect origins sharpens inspection focus. Each defect type follows a distinct formation pathway.
Voids form during casting when entrapped air or volatile compounds cannot escape before the resin gels. In quality assessments across 200+ epoxy insulator batches, voids larger than 0.5 mm consistently concentrate at resin-filler interfaces where wetting is incomplete. The exothermic curing reaction generates temperatures of 120–180°C, creating pressure gradients that nucleate gas bubbles.
The dielectric consequence is severe. Virgin epoxy withstands 20–25 kV/mm. A void drops local breakdown strength to approximately 3 kV/mm due to Paschen’s law effects in enclosed gas cavities. Partial discharge within these voids generates temperatures exceeding 500°C, progressively enlarging the defect.
Thermal cycling drives crack formation through coefficient of thermal expansion (CTE) mismatch. Unfilled epoxy exhibits CTE of 50–70 × 10⁻⁶/°C while copper conductors measure 17 × 10⁻⁶/°C. This mismatch generates interfacial stresses exceeding 15 MPa at temperature differentials of 80°C. Cracks propagate from sharp corners, filler clusters, and conductor interfaces.
Field experience with outdoor switchgear shows that temperature cycling between -25°C and +55°C produces micro-cracks at stress concentration points within 8–12 years of service.
Surface tracking represents progressive carbonization under sustained electrical stress combined with moisture and contaminants. When surface contamination creates conductive moisture films, leakage current flows. The current heats the surface unevenly, creating dry bands where resistance concentrates. Arcing across these dry bands carbonizes the epoxy, forming permanent conductive paths.
Coastal substation inspections demonstrate that salt fog contamination accelerates tracking initiation, reducing surface insulation resistance below 10 MΩ within 18 months of exposure.
[Expert Insight: Manufacturing Quality Indicators]
- Yellowed epoxy suggests overcure or UV exposure during storage—inspect more carefully for internal stress
- Flow marks on surfaces indicate mold filling problems that correlate with internal void clusters
- Sink marks near thick sections often overlay subsurface voids
- Batch-to-batch color variation warrants supplier quality discussion
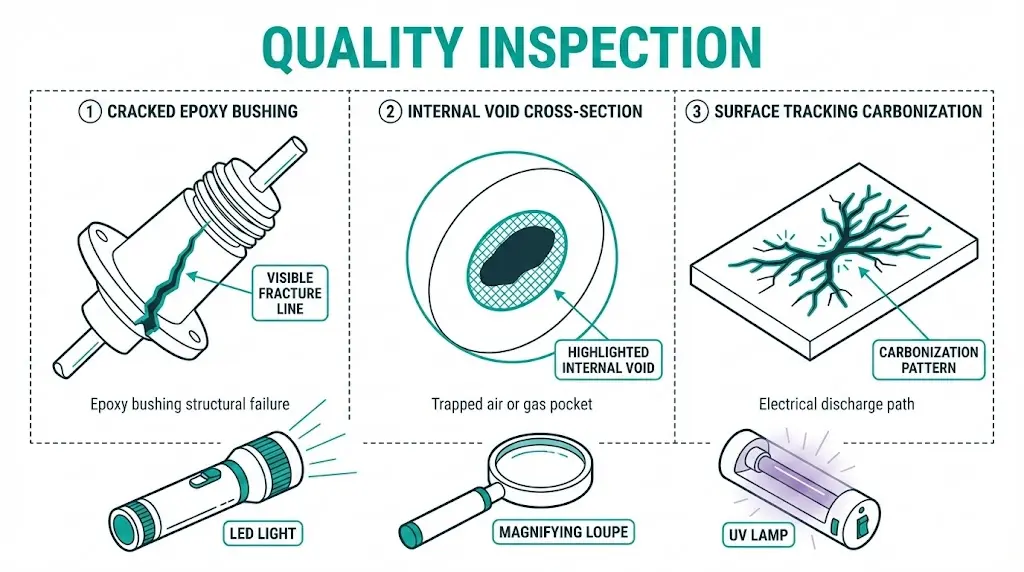
Visual inspection catches most crack defects when performed systematically with proper lighting.
Start with the part at arm’s length under diffuse ambient light. Rotate slowly through 360°. Surface cracks longer than 3 mm appear as shadow lines even without magnification.
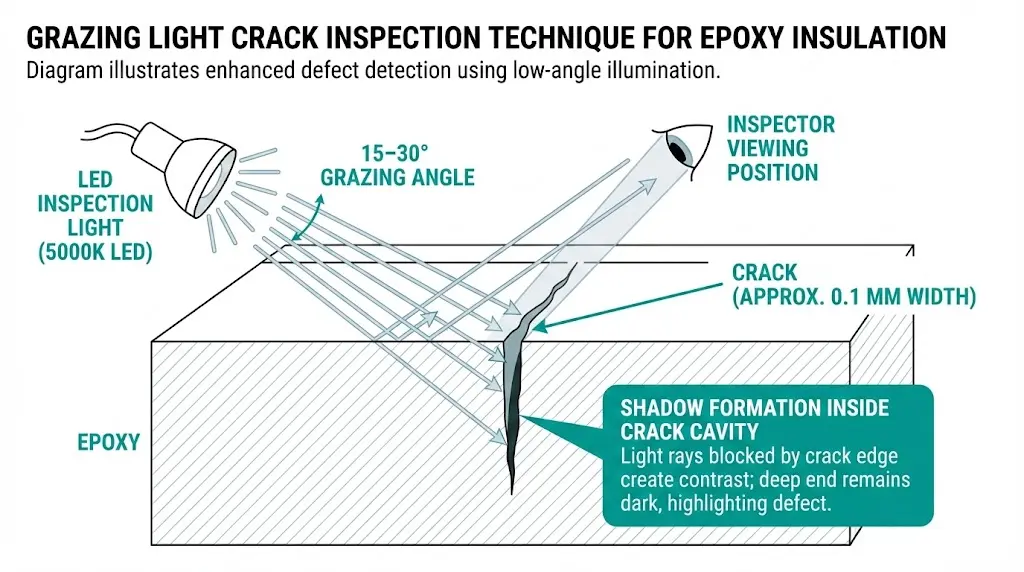
For detailed examination, position the LED light at 15–30° grazing angle to the surface. This low angle creates shadows that reveal crack depth and extent. Scan systematically from one end to the other, overlapping inspection zones.
UV inspection reveals cracks invisible under white light. Many manufacturers add fluorescent tracers to epoxy formulations. Under 365 nm illumination, cracks appear as bright lines against a darker background. This technique excels at finding hairline cracks in complex geometries.
Concentrate attention on high-stress areas:
Not every crack warrants rejection. Location and size determine the appropriate response.
| Crack Type | Location | Maximum Allowable | Action |
|---|---|---|---|
| Hairline <0.1 mm width | Non-stressed surface | 5 mm length | Accept with documentation |
| Hairline <0.1 mm width | Near metal insert | 2 mm length | Reject or consult manufacturer |
| Visible ≥0.1 mm width | Any location | Not acceptable | Reject |
| Through-crack | Any location | Not acceptable | Reject immediately |
Cracks near conductor interfaces demand strict interpretation. The electric field enhancement at a crack tip accelerates partial discharge inception. A hairline crack that might survive decades on an unstressed surface can progress to failure within months near a high-voltage conductor.
Document all accepted cracks with photographs and dimensional measurements. This baseline enables trending during subsequent inspections.
Internal voids require detection methods beyond visual inspection. Three techniques apply to field and factory settings.
Pulse-echo ultrasonic inspection detects voids ≥0.3 mm diameter in epoxy up to 80 mm thick. The technique works because voids create acoustic impedance mismatches that reflect ultrasound energy.
For field application:
PD testing identifies electrically active voids—those that will cause progressive damage. Apply voltage at 1.5–2.0 × rated phase-to-ground voltage and measure discharge magnitude.
PD testing during incoming inspection requires specialized equipment and controlled conditions. Many facilities reserve this method for high-value components or random sampling from large batches.
Industrial X-ray inspection reveals voids regardless of electrical activity. This method suits high-value components where internal void location matters as much as void presence. The technique identifies voids near conductor surfaces—the highest-risk locations—that ultrasonic methods may miss due to geometric complexity.
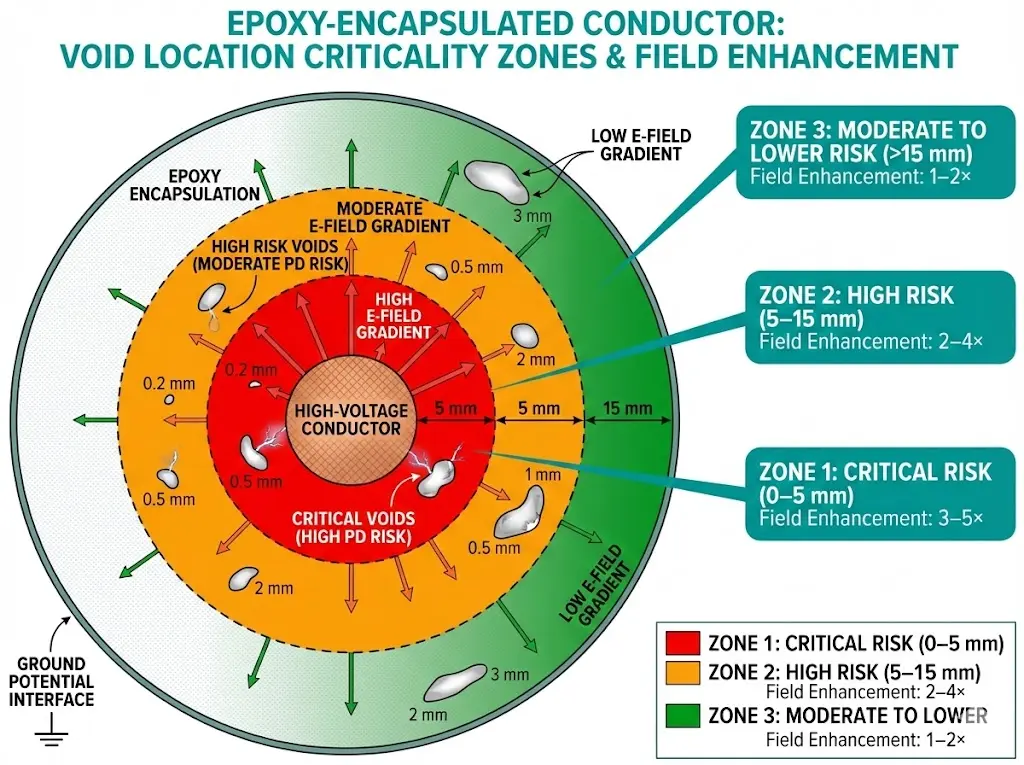
Position determines consequence. Voids near conductors experience field enhancement that accelerates partial discharge.
| Void Location | Relative Risk | Field Enhancement |
|---|---|---|
| Within 5 mm of conductor | Critical | 3–5× average field |
| At metal insert interface | High | 2–4× average field |
| Bulk material center | Moderate | 1–2× average field |
| Near grounded surface | Lower | 1–1.5× average field |
Reject any component with voids within 5 mm of conductor surfaces, regardless of void size.
[Expert Insight: Field PD Testing Realities]
- Background noise in operating substations often exceeds 5 pC—use gating and filtering
- Temperature affects PD magnitude; test at stable thermal conditions when possible
- A single PD test provides a snapshot; trending over time reveals degradation rate
- Correlation between UT void detection and PD activity runs approximately 70%—some voids remain inactive for years
Tracking damage leaves visible evidence on epoxy surfaces. Recognition enables intervention before flashover occurs.
Look for these indicators:
High-risk inspection areas include outdoor bushings, components in industrial environments with conductive dust, and parts near cable entries where condensation collects.
CTI quantifies tracking resistance. The IEC 60112 test applies ammonium chloride solution drops between electrodes while increasing voltage until tracking occurs. Results guide material selection:
| CTI Value | Classification | Application Suitability |
|---|---|---|
| ≥600 V | CTI 600 | Outdoor, contaminated environments |
| 400–599 V | CTI 400 | Indoor, normal environments |
| <400 V | Not recommended | Avoid for MV insulation |
Quality epoxy parts from established switchgear component manufacturers specify CTI ≥600 for any surface exposed to environmental contamination.
For components destined for outdoor VCB installations, verify CTI rating against site contamination severity. Coastal, industrial, and desert environments demand CTI 600 minimum.
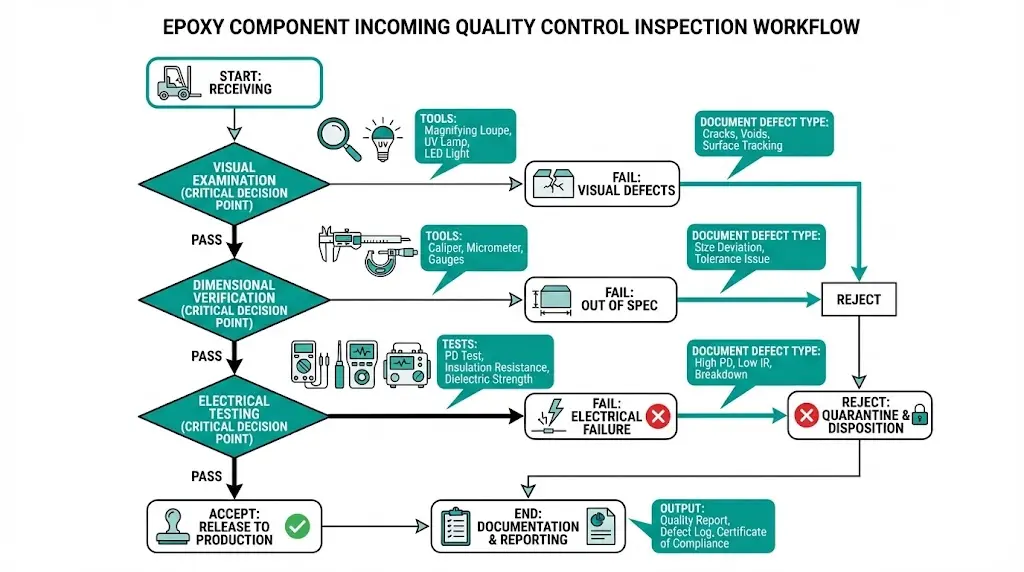
Systematic documentation transforms inspection from subjective assessment to defensible quality record.
Record for each inspected lot:
This documentation supports root cause analysis if field failures occur and provides evidence for warranty claims.
Epoxy component quality begins at manufacturing. XBRELE applies incoming material testing, vacuum casting process control, and 100% partial discharge verification to every epoxy part.
Standard specifications include:
Application engineering support addresses VCB pole assemblies, vacuum contactor housings, bus support insulators, and custom switchgear frame components.
Contact XBRELE for epoxy component specifications, material certifications, and sample evaluation.
External Reference: IEC 60071 — IEC 60071 insulation coordination
Voids from manufacturing defects cause the majority of in-service failures, with thermal cycling cracks as the second most common mechanism. Environmental tracking failures occur primarily in outdoor or contaminated installations where CTI ratings were inadequate for site conditions.
Location matters more than size. Cracks within 5 mm of any conductor surface or at metal insert interfaces pose dielectric risk regardless of visible dimensions. Cracks on unstressed external surfaces may be acceptable if documented and monitored.
PD magnitudes above 10 pC at 1.2 times rated voltage generally warrant investigation, though acceptable limits vary by component type and manufacturer specification. Trending is more valuable than single measurements—rising PD over time indicates active degradation.
Ultrasonic methods reliably detect voids ≥0.3 mm in accessible geometries but may miss defects near complex metal inserts or in thin sections. Combining UT with PD testing improves detection confidence for critical components.
Higher altitude reduces air density, lowering external flashover voltage but not affecting internal void behavior. Creepage distance becomes more critical above 1000 m elevation. Internal defect acceptance criteria remain unchanged.
Annual visual inspection catches gross degradation. PD testing every 3–5 years, or following significant fault events, provides quantitative condition assessment. Harsh environments with temperature cycling or contamination exposure may warrant more frequent evaluation.