Need Full Specifications?
Download our 2025 Product Catalog for detailed drawings and technical parameters of all switchgear components.
Get CatalogDownload our 2025 Product Catalog for detailed drawings and technical parameters of all switchgear components.
Get CatalogDownload our 2025 Product Catalog for detailed drawings and technical parameters of all switchgear components.
Get Catalog
Every switching device in a medium-voltage network depends on metal-to-metal contact interfaces to carry load current. These interfaces—measured in tens of micro-ohms when healthy—determine whether current flows efficiently or generates destructive heat. Micro-ohm contact resistance testing quantifies the condition of these critical junctions using specialized instruments capable of resolving resistance values below 100 µΩ.
This guide details the four-wire Kelvin measurement procedure, establishes baseline reference values for vacuum circuit breakers and contactors, and presents a trending methodology that transforms raw measurements into actionable maintenance decisions. The techniques apply across vacuum circuit breakers, vacuum contactors, disconnect switches, and bolted bus connections in distribution and industrial power systems, with switching-duty acceptance aligned to IEC 62271-100 test frameworks.
Micro-ohm contact resistance testing measures the electrical resistance across connection points in switchgear to identify degradation before failure occurs. This precision measurement technique detects resistance changes at the micro-ohm (µΩ) level, revealing contact erosion, contamination, or mechanical misalignment that standard multimeters cannot identify.
The underlying physics relies on Ohm’s law applied at precise current injection levels. When current flows through a contact interface, any resistance increase generates localized heating according to P = I²R. At 2000 A rated current, even a 20 µΩ increase produces 80 W of additional heat concentrated at that junction. In field testing across 200+ substation maintenance programs, contacts showing resistance values exceeding 150% of baseline consistently correlated with visible heat damage within 12–18 months.
Why Micro-Ohm Precision Matters
Standard digital multimeters resolve only to 0.1 Ω—insufficient for detecting early-stage contact degradation. Dedicated micro-ohmmeters achieve resolution of 0.1 µΩ, enabling detection of resistance increases as small as 10% above baseline values. This sensitivity allows maintenance teams to trend resistance over time and predict contact replacement needs before operational failures occur.
Typical resistance magnitudes for new equipment:
| Component | Typical Range |
|---|---|
| VCB main contacts (12–36 kV) | 20–60 µΩ |
| Vacuum contactor contacts | 15–45 µΩ |
| Bolted bus joints | 5–25 µΩ |
The failure progression follows a predictable sequence: oxide films develop on contact surfaces, resistance rises, localized hot spots form under load, and eventually contact welding or burn-through occurs. Early detection through micro-ohm testing interrupts this cascade.
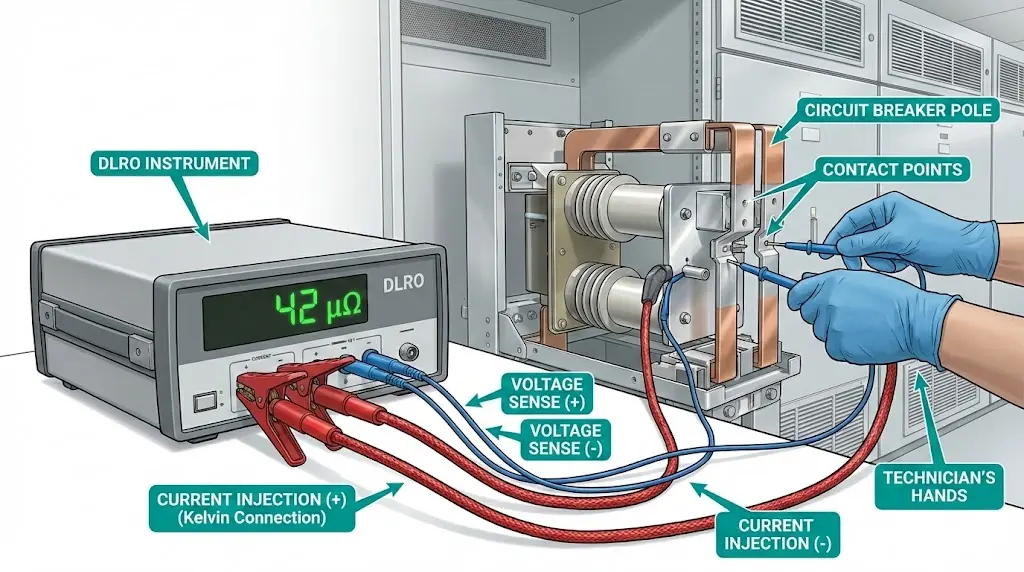
Reliable contact resistance measurement demands instrumentation designed specifically for micro-ohm ranges. Digital Low Resistance Ohmmeters (DLROs) inject controlled DC current while measuring voltage drop with microvolt resolution.
Micro-Ohmmeter Specifications
Test current capability determines measurement accuracy on power contacts. A 100 A DC minimum suffices for vacuum contactors, while 200–300 A provides more stable readings on high-current VCB connections. Lower currents may fail to break through surface oxide films, yielding artificially elevated resistance values.
| Feature | Field Minimum | Recommended (MV) |
|---|---|---|
| Max Test Current | 100 A DC | 200–600 A DC |
| Resolution | 1 µΩ | 0.1 µΩ |
| Accuracy | ±0.5% | ±0.25% of reading |
| Data Storage | 50 readings | 500+ with software |
| Lead Compensation | Manual | Automatic |
| Operating Range | 0–40°C | -10–50°C |
Auxiliary Equipment Checklist
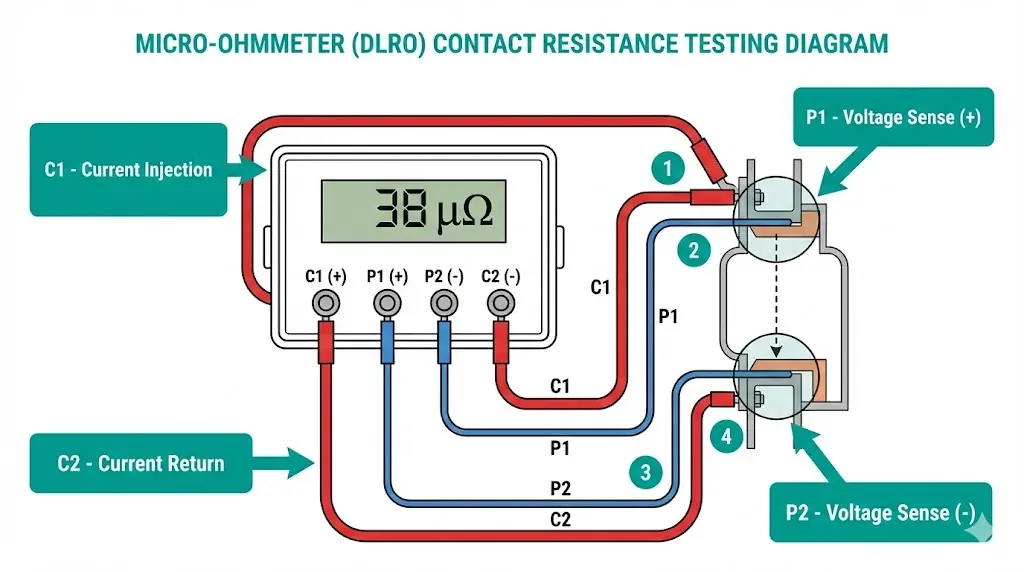
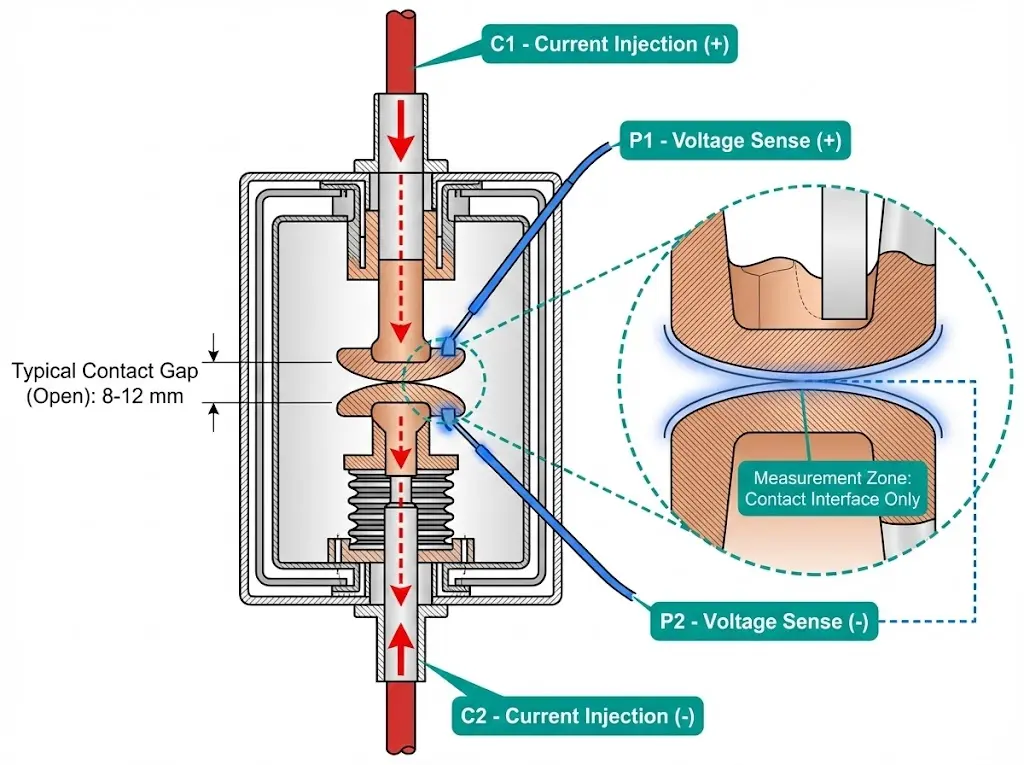
The Kelvin (four-wire) measurement technique eliminates lead resistance errors that would otherwise corrupt micro-ohm readings. Two current-carrying leads inject the test current, while two separate voltage-sensing leads measure the precise voltage drop across the contact interface only.
Pre-Test Safety and Isolation
Connection Setup
Position current leads (C1, C2) at the outermost points of the current path being tested. Place potential leads (P1, P2) inside the current connections, directly on the contact interface being measured. This arrangement ensures voltage measurement captures only the contact resistance, excluding lead and connection resistance.
Verify firm probe contact before initiating measurement. Loose connections introduce additional resistance that produces false high readings.
The resistance calculation follows: Rcontact = Vmeasured / Iinjected, where voltage resolution must reach ±1 μV to achieve micro-ohm accuracy. Test currents below 10% of rated current may not properly seat contact surfaces, while currents exceeding equipment ratings risk thermal damage.
Measurement Execution
Temperature Correction
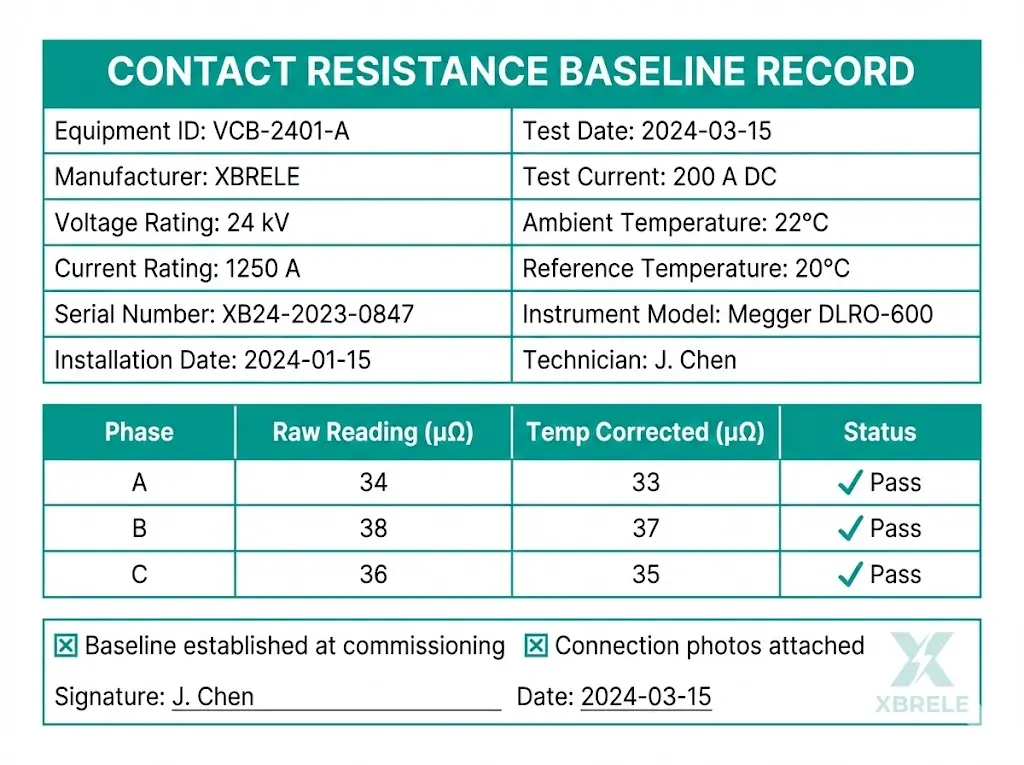
Contact resistance varies approximately 0.393% per °C for copper contacts. Normalize all readings to 20°C reference temperature for valid trending comparison. Document both raw measurement and temperature-corrected value.
[Expert Insight: Field Measurement Tips]
- Allow micro-ohmmeter to warm up 10 minutes before critical measurements
- Clean probe tips with isopropyl alcohol between test points to prevent contamination carryover
- On outdoor switchgear, shield connections from direct sunlight to minimize thermal gradients
- Document connection photographs for each test point to ensure repeatability across maintenance intervals
Every contact system requires a reference baseline captured during commissioning or immediately after maintenance. Without established baselines, individual measurements provide limited diagnostic value—a reading of 45 µΩ means nothing without context.
Factory Acceptance Test Records
The ideal baseline source is the manufacturer’s factory acceptance test (FAT) certificate. Record values for all three phases along with serial number, test current used, and ambient temperature. When FAT data is unavailable, the first field measurement after installation becomes the de facto baseline.
Industry Reference Values and Thresholds
| Equipment Type | New Resistance | Alert (Investigate) | Action (Remove) |
|---|---|---|---|
| VCB main contacts (12–36 kV) | 25–60 µΩ | >1.5× baseline | >2× baseline |
| Vacuum contactor (7.2–12 kV) | 15–45 µΩ | >1.5× baseline | >2× baseline |
| Disconnect switch blade | 30–80 µΩ | >2× baseline | >3× baseline |
| Bolted bus joint | 5–25 µΩ | >1.5× baseline | >2× baseline |
According to IEC 62271-100, circuit breaker contact resistance should remain below manufacturer-specified limits throughout equipment service life.
Documentation Requirements
Complete baseline records include:
Single-point measurements offer limited diagnostic value. Effective condition assessment relies on trending contact resistance over time, correlating changes with switching operations, fault clearing events, and environmental exposure.
Recommended Test Intervals
| Service Duty | Test Interval |
|---|---|
| Light (few operations/year) | 3–5 years or scheduled outage |
| Moderate (monthly operations) | 1–2 years |
| Heavy (frequent switching) | 6–12 months |
| After fault interruption | Immediately |
Building the Trend Curve
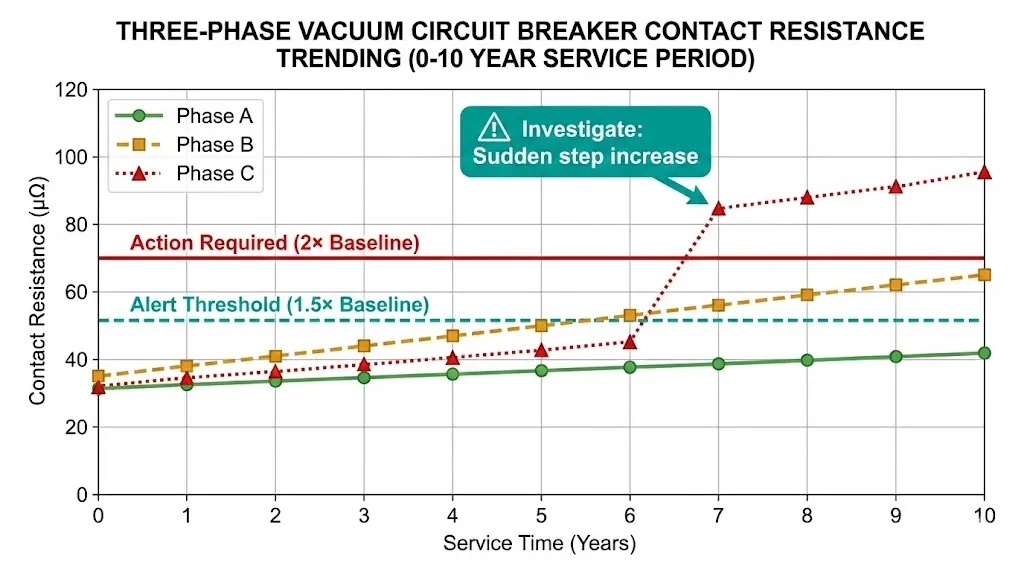
Plot resistance versus cumulative operations or calendar time. Normalize all readings to 20°C reference. Calculate the slope between consecutive measurements and flag any single-point jump exceeding 20% from the previous reading.
Analysis of 15,000 measurement records shows that contacts exhibiting resistance growth rates exceeding 10 µΩ per year consistently require intervention within 3–5 years. The rate of change matters as much as absolute values—a contact showing 5 µΩ annual increase may require action sooner than one showing 15 µΩ total increase over ten years.
Trend Pattern Interpretation
Healthy Pattern: Slow, linear increase over service life. All phases track similarly. Values remain below 1.5× baseline.
Warning Pattern: Slope acceleration between measurements. Single reading jumps more than 20%. Phase-to-phase imbalance developing beyond 30% difference.
Critical Pattern: Exceeds 2× baseline. Erratic readings suggesting intermittent contact. Visible thermal discoloration during inspection.
Decision Matrix
| Measured Condition | Required Action |
|---|---|
| <1.5× baseline, stable trend | Continue scheduled monitoring |
| 1.5–2× baseline | Shorten interval; schedule internal inspection |
| >2× baseline OR rapid rise | Remove from service; inspect/refurbish contacts |
| Exceeds OEM absolute limit | Mandatory replacement |
[Expert Insight: Trending Best Practices]
- Plot operations count on X-axis when available—wear correlates more strongly with switching duty than calendar time
- Maintain separate trend charts for each pole; averaging across phases masks developing asymmetric degradation
- After contact cleaning or refurbishment, establish a new baseline rather than continuing the previous trend
- Export trending data to asset management systems for automated threshold alerting
Testing errors introduce systematic bias that corrupts baseline establishment and trend analysis. Recognizing common mistakes prevents false positives that trigger unnecessary maintenance and false negatives that miss genuine degradation.
| Error | Consequence | Prevention |
|---|---|---|
| Insufficient test current | Surface films not penetrated; false high reading | Use ≥100 A contactors, ≥200 A VCBs |
| Poor probe contact | Lead/connection resistance added to reading | Clean surfaces; use spring-loaded Kelvin clips |
| Parallel paths present | Current bypasses test point; false low reading | Open all CT secondaries, remove bypass grounds |
| Temperature ignored | Summer/winter readings incomparable | Record temperature; apply correction factor |
| Single measurement only | No repeatability verification | Minimum 2–3 readings per test point |
| Wrong measurement points | Includes resistance beyond contact interface | Place P1/P2 immediately adjacent to contact faces |
| Dirty contact surfaces | Contamination inflates reading | Clean with approved solvent if site permits |
When measurements exceed expected values, verify test setup integrity before concluding contact degradation. Confirm injection current meets minimum requirements and connection resistance contribution remains below 5 µΩ. Repeat measurement at multiple current levels (100 A, 150 A, 200 A)—non-linear current-resistance relationships indicate oxide films or insufficient contact pressure rather than fundamental contact wear.
For vacuum circuit breaker contact assemblies showing elevated resistance, cleaning and mechanical adjustment often restore acceptable values without requiring complete replacement.
Contact resistance testing provides critical insight into current path condition but cannot assess all failure modes. Comprehensive condition-based maintenance programs combine multiple diagnostic techniques.
Complementary Test Methods
Timing Analysis: Measures operating mechanism speed and synchronization. Slow operation or phase timing deviation indicates mechanical problems that compound contact degradation.
Insulation Resistance / Power Factor: Assesses dielectric system health. Good contact resistance paired with degraded insulation metrics points to problems outside the current path—interphase barriers, support insulators, or vacuum integrity.
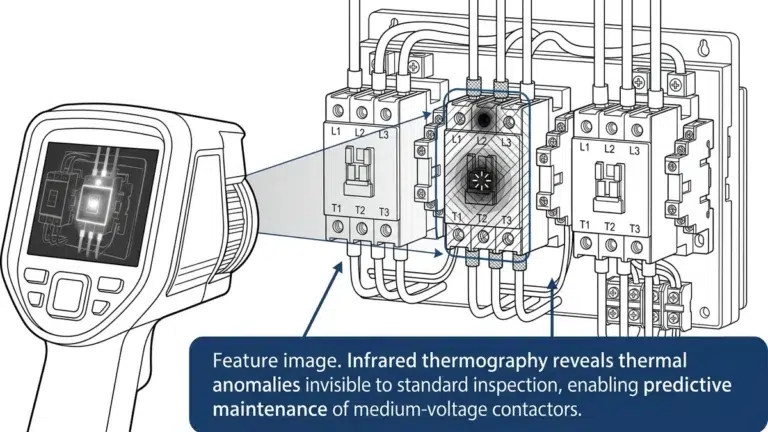
Thermography (Energized): Confirms hot spots under actual load current. Correlates directly with contact resistance findings and identifies problems that appear only during operation.
Vacuum Integrity Test: Required for VCB interrupting capability assessment. Contact resistance alone cannot detect vacuum loss; magnetron or high-voltage withstand testing provides definitive vacuum verification.
No single test delivers complete condition assessment. Contact resistance indicates current path health, timing reveals mechanical health, insulation tests assess dielectric health, and vacuum testing confirms interrupting capability. Integration of all parameters supports defensible maintenance decisions.
CIGRE Technical Brochure 510 provides comprehensive guidance on condition assessment techniques for high-voltage circuit breakers, including recommended test combinations and interpretation frameworks.
XBRELE manufactures vacuum circuit breakers and vacuum contactors engineered for consistent contact performance across extended service life. Every unit ships with factory acceptance test data including micro-ohm contact resistance verification on all poles, providing the baseline documentation essential for effective trending programs.
Technical documentation packages support maintenance planning with recommended test intervals based on application duty cycle. When contact degradation reaches action thresholds, replacement interrupters and contact assemblies are available for refurbishment programs—extending equipment life without complete breaker replacement.
Engineering support covers specification development for new installations and condition assessment consultation for existing switchgear fleets.
Request factory test certificates, discuss VCB specifications, or source replacement contact assemblies—contact XBRELE’s technical team.
What test current should be used for contact resistance testing on medium-voltage switchgear?
Apply 100 A DC minimum for vacuum contactors and 200 A DC or higher for vacuum circuit breakers rated above 1250 A. Higher currents penetrate surface oxide films more effectively, producing stable readings that reflect true contact condition rather than surface contamination effects.
How often should contact resistance measurements be performed on circuit breakers?
Test every 3–5 years for equipment with minimal switching duty, annually for moderate-duty applications, and every 6–12 months for frequent-switching service such as capacitor bank or motor starting duty. Always test immediately after any fault interruption event regardless of scheduled intervals.
What contact resistance value indicates a developing problem?
Investigate when measured resistance exceeds 1.5 times the established baseline value. Plan removal and refurbishment when readings exceed 2 times baseline or surpass the manufacturer’s absolute limit, whichever occurs first.
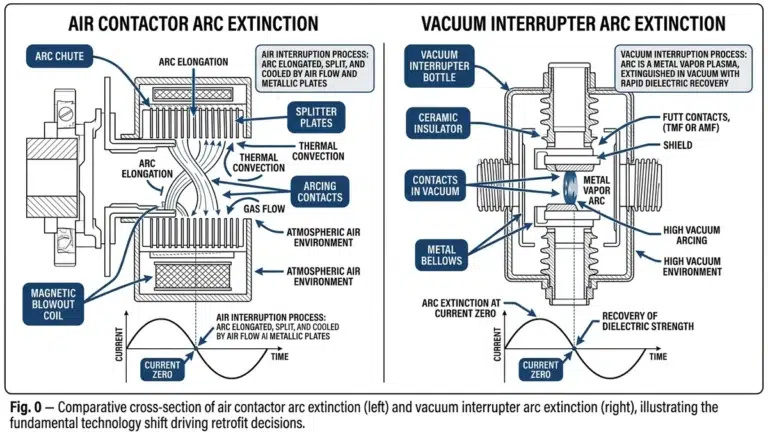
Why does contact resistance increase over time in vacuum interrupters?
Contact erosion from arc interruption reduces effective contact area, oxide films form on exposed copper-chromium surfaces between operations, and mechanical wear gradually decreases contact pressure—all mechanisms that increase interface resistance progressively.
Can contact resistance testing detect vacuum loss in a VCB interrupter?
Not reliably. Contact resistance measures current path condition only. Severe vacuum loss may eventually cause contact surface oxidation that elevates readings, but this represents an indirect indicator appearing late in the degradation process. Dedicated magnetron or high-voltage withstand testing provides definitive vacuum integrity assessment.
What causes measurement variation between consecutive readings on the same contact?
Probe contact quality, temperature changes, and instrument stabilization time typically cause reading scatter. Maintain consistent probe pressure of 2–4 N, allow 3–5 seconds for current stabilization, and record ambient temperature. Variation exceeding ±5% after controlling these factors suggests genuine contact instability requiring investigation.
Should baseline values be re-established after contact maintenance?
Yes. After cleaning, refurbishment, or contact replacement, capture new baseline measurements rather than continuing the previous trend curve. Document the maintenance action in test records to explain the discontinuity in historical data.