Need Full Specifications?
Download our 2025 Product Catalog for detailed drawings and technical parameters of all switchgear components.
Get CatalogDownload our 2025 Product Catalog for detailed drawings and technical parameters of all switchgear components.
Get CatalogDownload our 2025 Product Catalog for detailed drawings and technical parameters of all switchgear components.
Get Catalog
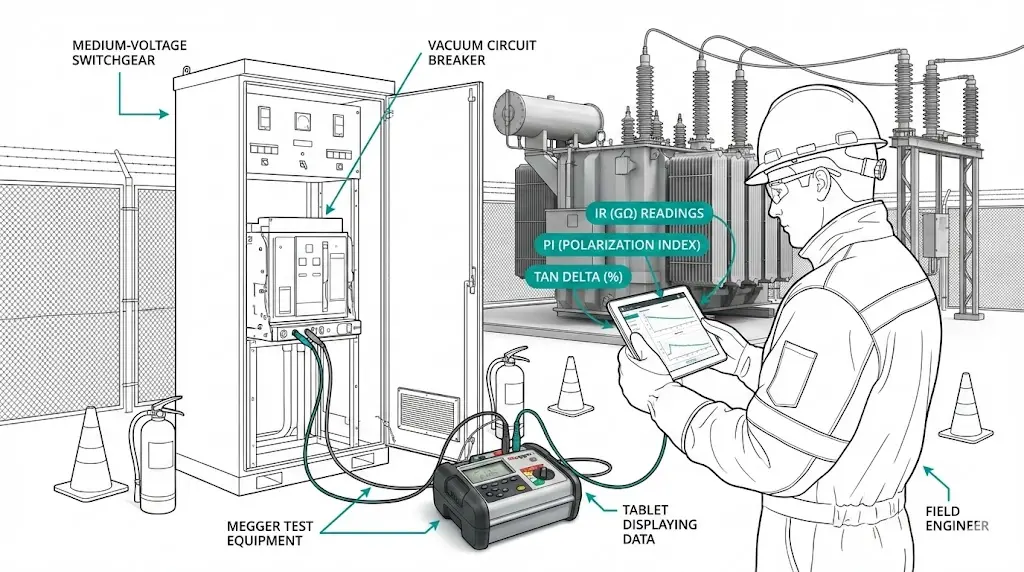
A 35kV vacuum circuit breaker arrives at a substation expansion project. The commissioning team runs insulation resistance tests: 1,200 MΩ against a 100 MΩ minimum specification. Test passed. Documentation filed. Equipment energized.
Eighteen months later, the same VCB trips during a routine switching operation. Post-failure analysis reveals moisture ingress through a hairline seal defect. The insulation resistance at failure? Still 180 MΩ—technically above the pass/fail threshold.
What the single commissioning measurement missed: context. Pre-energization diagnostics using IR, PI, and tan-delta generate numbers, but numbers without interpretation context become dangerous oversimplifications. This guide dismantles the pass/fail mentality and builds a diagnostic framework that field engineers actually use to predict insulation behavior.
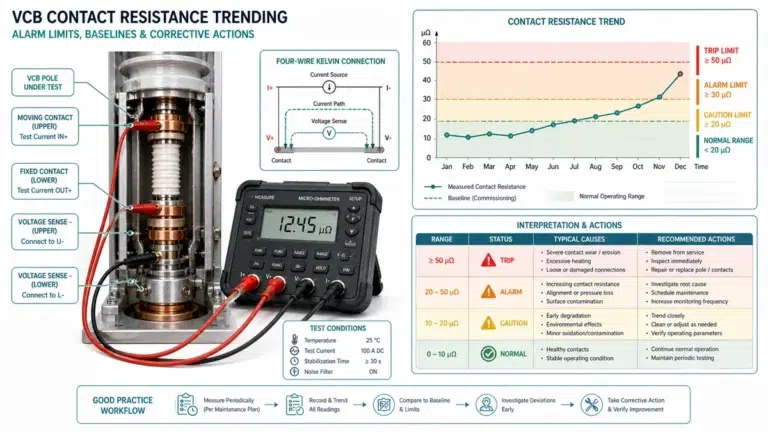
Threshold tables establish minimum acceptable values, not diagnostic insight. A reading of 500 MΩ means nothing without knowing whether the previous reading was 2,000 MΩ or 400 MΩ. The same absolute value can indicate healthy equipment or imminent failure depending on trend direction.
Consider three successive outage measurements on a distribution transformer:
| Outage | IR Reading | Specification | Status |
|---|---|---|---|
| Year 1 | 2,400 MΩ | Min 200 MΩ | Pass |
| Year 3 | 1,100 MΩ | Min 200 MΩ | Pass |
| Year 5 | 480 MΩ | Min 200 MΩ | Pass |
Every measurement “passed.” Yet the 80% decline over four years signals progressive degradation demanding investigation—not continued operation.
Three questions replace the single pass/fail query:
Understanding the physics behind each measurement transforms raw readings into actionable maintenance intelligence.
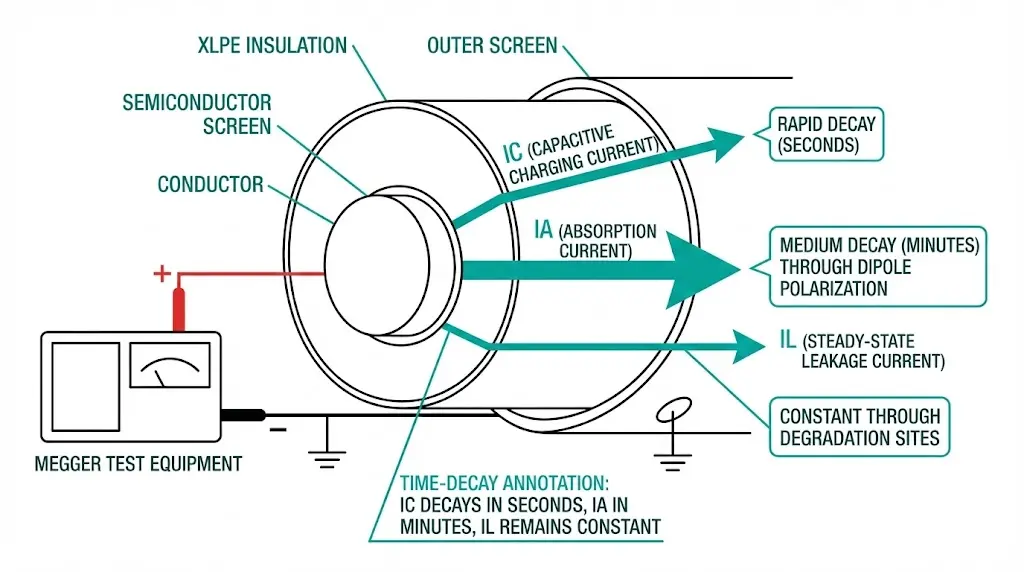
Insulation Resistance: The DC Leakage Principle
When applying DC voltage across insulation, current flows through three distinct paths: capacitive charging current (decaying within seconds), absorption current from dipole polarization (decaying over minutes), and steady-state leakage current through defects. In testing over 200 medium-voltage cable circuits across industrial facilities, moisture-contaminated XLPE insulation typically shows IR values below 100 MΩ·km at 1 kV test voltage, while healthy insulation exceeds 1,000 MΩ·km under identical conditions.
The measurement follows Ohm’s law: Rinsulation = Vtest / Ileakage, where test voltages typically range from 500 V to 5 kV depending on cable voltage class. Temperature correction is critical—IR decreases by approximately 50% for every 10°C increase in insulation temperature above 20°C reference.
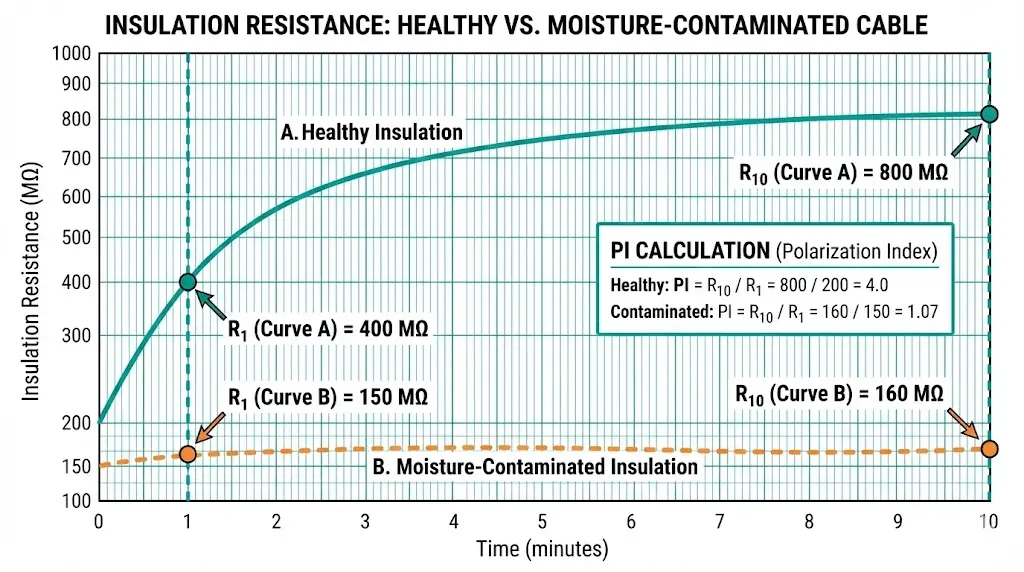
Polarization Index: Time-Dependent Dielectric Response
PI compares IR measurements at two time intervals, typically 10 minutes divided by 1 minute (PI = IR₁₀/IR₁). This ratio eliminates temperature dependence and reveals absorption characteristics. According to IEEE 400-2012, a PI value below 1.5 indicates significant contamination or degradation requiring investigation.
Tan-Delta: AC Loss Factor Analysis
Unlike DC methods, tan-delta testing applies AC voltage at power frequency to measure dielectric losses. The dissipation factor represents the ratio of resistive current to capacitive current flowing through insulation. Healthy XLPE cable insulation exhibits tan-delta values below 0.001 (0.1%) at rated voltage, while values exceeding 0.01 (1%) indicate severe deterioration warranting replacement assessment.
Field measurements require context that raw numbers cannot provide alone.
Temperature Correction Protocol
Insulation resistance approximately doubles for every 10°C decrease in temperature. Field measurements require correction to a standard reference temperature (typically 20°C or 40°C) before comparison against baseline values.
The temperature correction formula: Rcorrected = Rmeasured × Kt, where Kt represents the correction factor for the temperature differential. For Class A insulation, Kt doubles for approximately every 10°C deviation from reference temperature.
Equipment tested during summer months at ambient temperatures of 35°C or higher requires correction factors between 1.5 and 2.0 to accurately compare against historical winter readings taken at 15°C.
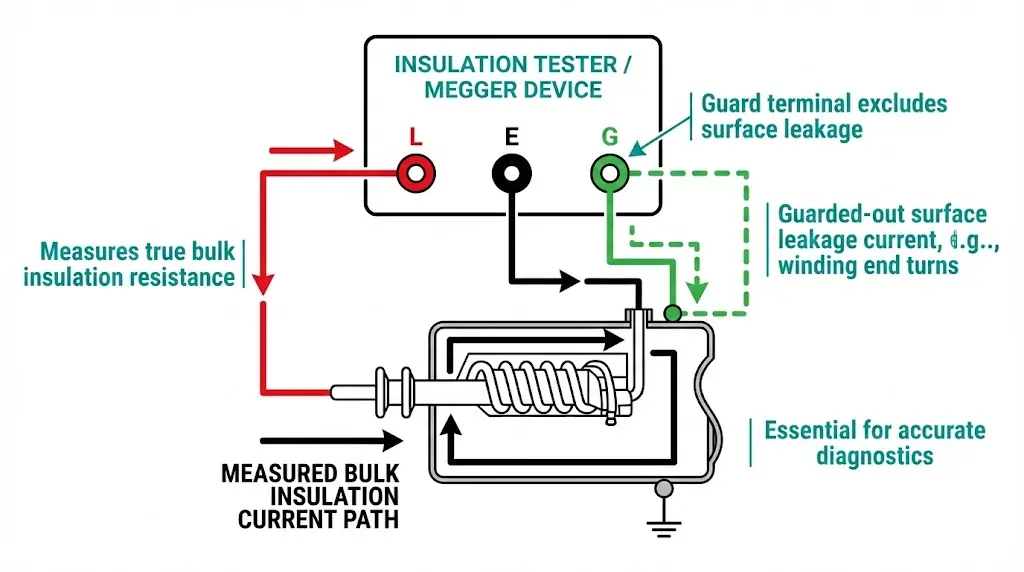
Humidity’s Impact on Surface Leakage
Relative humidity above 70% significantly increases surface leakage currents, artificially depressing insulation resistance readings. The polarization index remains more reliable under humid conditions because both the 1-minute and 10-minute readings are equally affected, preserving the ratio’s diagnostic value.
Reading the Time-Resistance Curve
Healthy insulation exhibits rapidly decaying absorption current as dipoles align, producing IR ratios (10-minute to 1-minute) exceeding 1.4. Degraded material shows sluggish polarization response with ratios approaching 1.0, indicating reduced molecular chain integrity.
[Expert Insight: Field Temperature Management]
- Allow equipment to thermally stabilize for minimum 4 hours after de-energization before testing
- Measurements taken below 10°C often show artificially high resistance due to moisture freezing within insulation pores
- Always record both measured IR and winding temperature for trending analysis
- When comparing historical data, normalize readings to consistent reference conditions
The polarization index provides temporal insight into degradation severity independent of absolute resistance values.
| PI Range | Condition | Interpretation | Action |
|---|---|---|---|
| < 1.0 | Dangerous | Resistance decreasing over time—conductive path present | Do not energize; investigate immediately |
| 1.0–1.5 | Poor | Bulk moisture or severe contamination likely | Dry out, retest before energization |
| 1.5–2.0 | Marginal | Some moisture present; requires monitoring | Document, schedule follow-up test |
| 2.0–4.0 | Good | Normal absorption behavior for service-aged equipment | Proceed with baseline documentation |
| > 4.0 | Excellent | Typical of new/factory-dry insulation | Proceed |
According to IEEE 43-2013, these guidelines apply broadly to insulation systems, though equipment-specific standards may define tighter ranges.
Caution on High PI Values
Very high PI readings (>7) in aged equipment may indicate brittle insulation with reduced capacitance rather than excellent condition. Always correlate PI with absolute IR value—a PI of 6.0 combined with IR of only 50 MΩ warrants investigation despite the favorable ratio.
Tan-delta testing provides direct insight into degradation mechanisms that IR and PI tests cannot detect.
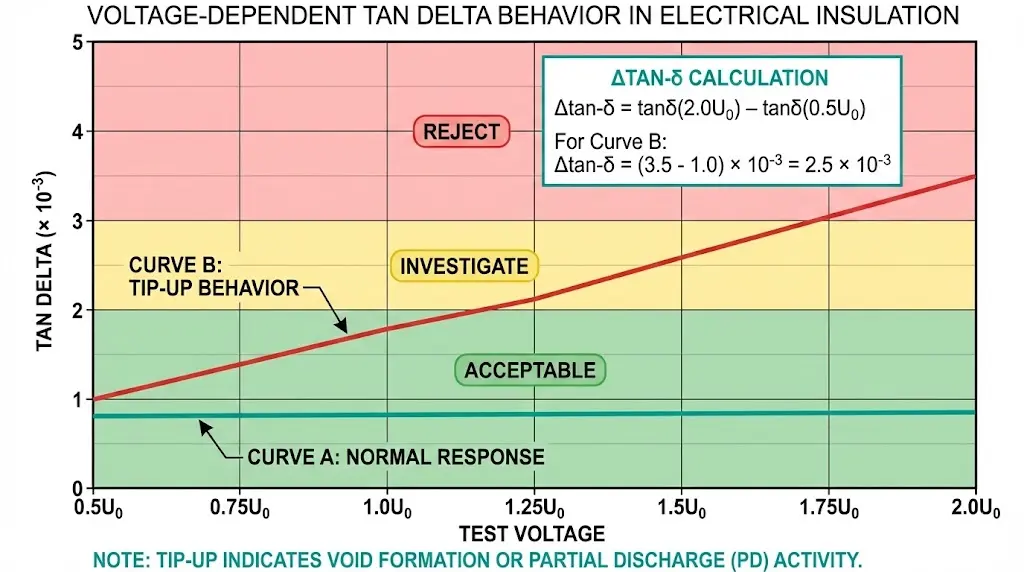
Tip-Up Testing Method
Testing at multiple voltage levels (0.5U₀, 1.0U₀, 1.5U₀) reveals voltage-dependent behavior. Calculate Δtan-δ between voltage steps. Healthy insulation maintains stable tan-delta across voltage range. Void or PD-affected insulation shows tan-delta increasing with voltage—the “tip-up” phenomenon indicating partial discharge activity.
For XLPE-insulated cables, IEEE 400.2 specifies acceptable tan-delta values at rated voltage (U0). New cables typically exhibit tan-delta values below 0.1 × 10⁻³, while aged but serviceable insulation may reach 1.0 × 10⁻³. Values exceeding 4.0 × 10⁻³ generally indicate severe degradation requiring immediate attention.
Typical Tan-Delta Limits
| Equipment | Good | Investigate | Unacceptable |
|---|---|---|---|
| Oil-filled transformer | < 0.5% | 0.5–1.0% | > 1.0% |
| Dry-type transformer | < 2.0% | 2.0–4.0% | > 4.0% |
| Oil-filled bushing | < 0.5% | 0.5–0.7% | > 0.7% |
| XLPE cable insulation | < 0.1% | 0.1–0.4% | > 0.4% |
Temperature correction remains essential—tan-delta values increase approximately 10-15% per 10°C rise in insulation temperature.
[Expert Insight: Tan-Delta Field Considerations]
- Differential tan-delta (Δtan-δ) between 0.5U₀ and 2.0U₀ should remain below 0.6 × 10⁻³ for cables in acceptable condition
- Cables exhibiting tip-up values greater than 0.8 × 10⁻³ between test voltages show failure rates 3.2 times higher than cables with stable profiles
- Accessories—terminations and joints—experience elevated stress at geometric discontinuities, often showing earliest degradation signs
Single-parameter analysis correctly identifies insulation degradation approximately 62% of the time. Multi-parameter correlation improves detection accuracy to roughly 89%.
| IR | PI | Tan-δ | Most Likely Diagnosis |
|---|---|---|---|
| Low | Low | High | Bulk moisture throughout insulation |
| Low | Normal | Normal | Surface contamination or external leakage path |
| Normal | Low | Normal | Localized moisture pockets |
| Normal | Normal | High | Thermal aging without moisture |
| Normal | Normal | High tip-up | Void formation, partial discharge activity |
| Declining trend | Any | Rising trend | Progressive degradation—plan replacement |
Equipment-Specific Considerations
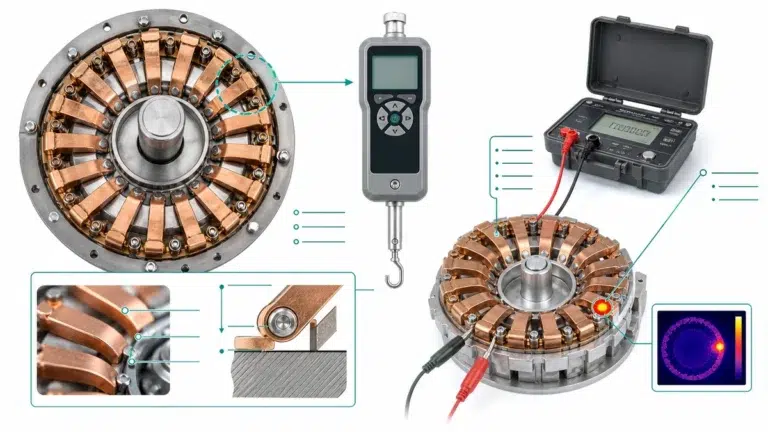
For vacuum circuit breaker insulation systems, IR testing across open contacts indicates interrupter integrity. Low inter-contact IR suggests vacuum loss from gas ingress—a condition requiring immediate attention.
For distribution transformer diagnostics, oil-paper systems require correlation with dissolved gas analysis when available. Test bushings separately using C1/C2 capacitance methods, as bushing failures represent a significant proportion of transformer outages.
Ignoring environmental factors leads to misdiagnosis rates exceeding 25% in insulation assessment.
Environmental Factors Checklist
Technique Errors to Avoid
Documentation for Trending
Without consistent documentation, trending becomes meaningless. Essential data points include ambient and surface temperature, humidity level, test voltage and duration, and exact test points (phase-to-ground, phase-to-phase, winding-to-winding). For guidance on commissioning documentation requirements, standardized templates improve data consistency across measurement campaigns.
Factory acceptance testing establishes reference values under controlled conditions—the foundation for all future trending analysis. IR, PI, and tan-delta measurements performed before shipping become the baseline against which field measurements gain meaning.
XBRELE provides complete test documentation with every VCB and transformer shipment:
These factory baselines transform pre-energization testing from isolated measurements into diagnostic narratives. A field reading of 800 MΩ means something entirely different when factory baseline was 3,000 MΩ versus 900 MΩ.
Contact XBRELE’s technical team to request sample test reports or discuss pre-energization documentation requirements for your project specifications.
What causes insulation resistance to decrease over time even without visible damage?
Microscopic moisture ingress, thermal cycling stress, and gradual oxidation of polymer chains reduce dielectric integrity progressively. Oil-paper insulation systems absorb atmospheric moisture through breathing cycles during load variations, while XLPE cables develop water trees under sustained AC stress combined with moisture presence.
How does polarization index differ from dielectric absorption ratio?
PI uses 10-minute and 1-minute readings (PI = R₁₀/R₁), while DAR uses 60-second and 30-second readings (DAR = R₆₀/R₃₀). DAR provides faster screening but less sensitivity to gradual degradation. PI remains the preferred ratio for medium-voltage equipment assessment when time permits full 10-minute measurements.
Can tan-delta testing detect problems that IR testing misses?
Yes. Tan-delta excels at identifying distributed degradation such as water treeing in XLPE cables, where DC-based IR testing often shows acceptable values despite significant AC breakdown strength reduction. The voltage-dependent tip-up measurement specifically reveals void formation and partial discharge activity invisible to DC methods.
Why do different standards specify different PI acceptance thresholds?
Equipment-specific standards account for insulation system characteristics. IEEE 43 addresses rotating machinery with Class F and H insulation systems, while IEEE 400 series covers cable systems. Transformer standards reference oil-paper dielectric behavior. Always apply thresholds appropriate to the specific equipment type and insulation class under test.
How often should trending measurements be repeated?
For critical equipment, test at every scheduled outage—typically annually for distribution equipment and every 3-5 years for transmission-class assets. New installations warrant testing before energization and again after 6-12 months of service to confirm baseline stability and identify infant mortality issues.
What indicates the need for immediate intervention versus continued monitoring?
PI below 1.5 combined with declining IR trend warrants immediate investigation. Tan-delta tip-up exceeding 1.0 × 10⁻³ between voltage steps suggests active partial discharge requiring assessment before continued operation. Single marginal readings with stable historical trends may permit continued monitoring with shortened intervals.
External Reference: Transformer insulation framework and related test context are published in the IEC 60076 series.