Need Full Specifications?
Download our 2025 Product Catalog for detailed drawings and technical parameters of all switchgear components.
Get CatalogDownload our 2025 Product Catalog for detailed drawings and technical parameters of all switchgear components.
Get CatalogDownload our 2025 Product Catalog for detailed drawings and technical parameters of all switchgear components.
Get Catalog
Busbar insulation serves as the critical dielectric barrier between energized conductors and ground or adjacent phases. Thermal performance directly determines insulation service life—and when that insulation degrades, the thermal signature becomes your earliest warning. This guide connects material selection for sleeving and barriers with actionable infrared thermography thresholds, giving maintenance teams the framework to detect problems before they escalate.
The physics governing busbar thermal behavior centers on three heat transfer mechanisms: conduction through the conductor cross-section, convection from exposed surfaces, and radiation exchange with enclosure walls. Copper busbars generate heat through I²R losses, with resistance increasing approximately 0.4% per degree Celsius rise. This positive temperature coefficient creates a thermal feedback loop—higher temperatures increase resistance, which increases losses, further raising temperature.
Power loss follows P = I²R, where a 2000 A busbar with resistance of 15 μΩ/m generates approximately 60 W/m of heat under full load conditions. This thermal energy must dissipate effectively; otherwise, conductor temperatures can exceed 90°C—the typical continuous rating limit for most insulation materials per IEC 61439-1 (low-voltage switchgear assemblies).
Insulation materials must withstand continuous operating temperatures while maintaining dielectric strength. According to IEC 62271-200 for AC metal-enclosed switchgear, insulation systems are classified by thermal endurance: Class B materials rated for 130°C maximum hot-spot temperature, Class F for 155°C, and Class H for 180°C. Exceeding these limits by just 10°C can reduce insulation life by 50% due to accelerated polymer chain degradation.
Heat dissipation capacity depends significantly on installation configuration. Vertically mounted busbars demonstrate 15–25% better natural convection cooling compared to horizontal mounting due to enhanced chimney effect airflow.
In field assessments across 80+ industrial substations, approximately 65% of busbar insulation failures originate from overlooked thermal stress zones rather than direct electrical faults. Understanding these mechanisms enables targeted inspection protocols.
Prolonged exposure to temperatures exceeding 90°C accelerates polymer chain breakdown. Cross-linked polyolefin materials exhibit service life reduction of approximately 50% for every 10°C increase above their rated continuous operating temperature.
When busbar sleeving develops micro-voids or delamination—often from improper installation shrinkage—partial discharge inception occurs at electric field concentrations exceeding 3 kV/mm. According to IEC 60270 [VERIFY STANDARD: specific clause for PD threshold levels], sustained partial discharge activity above 10 pC accelerates insulation erosion and creates carbonized tracking paths.
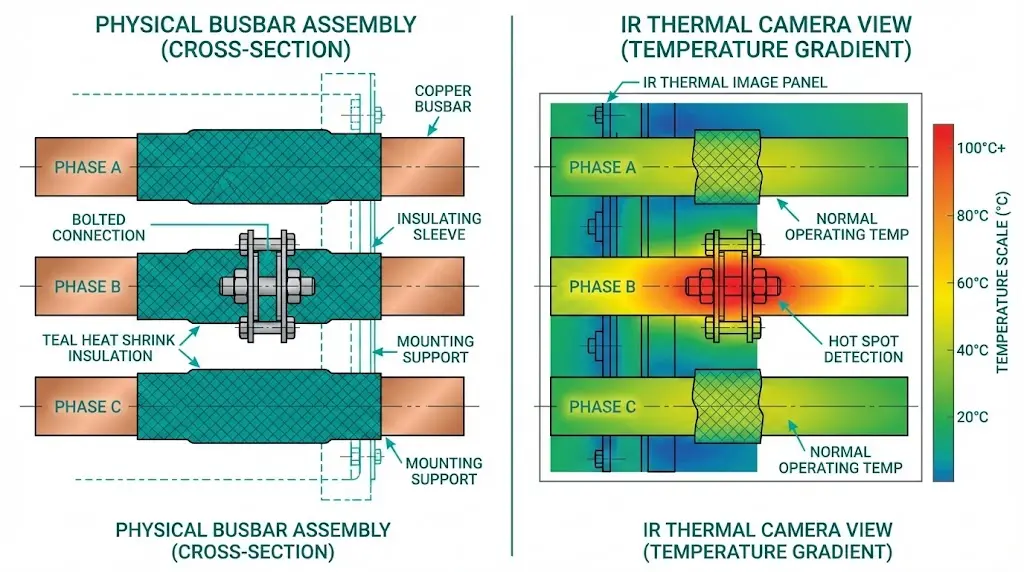
This mechanism initiates when localized heating at connection points increases contact resistance. The elevated resistance generates additional heat, which further increases resistance in a self-reinforcing cycle. Joints exhibiting temperature rises greater than 35 K above ambient typically indicate resistance values 2–3 times higher than specification.
Humidity levels above 85% RH combined with conductive dust contamination create surface leakage currents that bridge insulation barriers. Mining and cement processing facilities present particularly aggressive conditions, where airborne particulates reduce surface resistivity below 10⁹ Ω—the threshold where tracking becomes probable.
Phase-to-phase barriers experience differential thermal expansion stress. Aluminum busbars (coefficient ~23 μm/m·K) paired with rigid epoxy barriers can develop interface separation after repeated load cycling, compromising both dielectric and thermal transfer properties.
[Expert Insight: Field Observations on Failure Patterns]
- Corner and termination points fail first in approximately 70% of busbar insulation breakdown incidents
- Air pockets trapped during heat-shrink installation create discharge sites that erode insulation over 6–18 months
- Thermal runaway typically progresses from initial hot spot detection to critical failure within 15–45 minutes under load
- Post-fault inspection must account for thermal shock damage even when visible charring is absent
Selecting the appropriate insulation method requires matching material properties to voltage class, thermal requirements, and installation constraints.
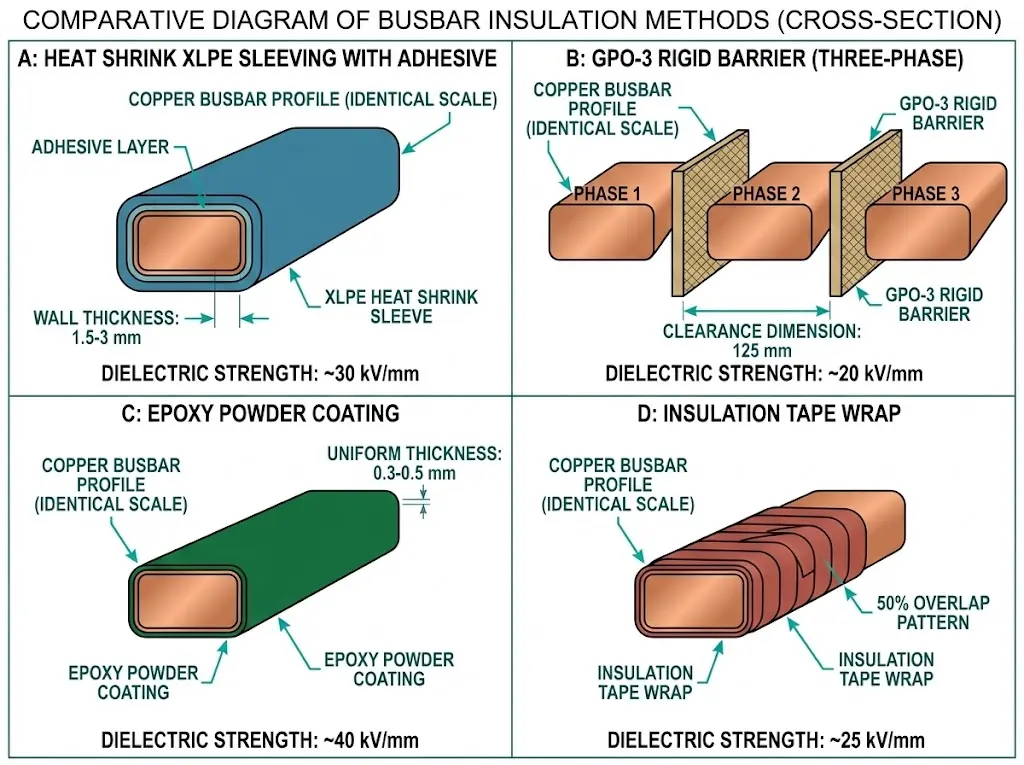
Standard polyolefin operates up to 105°C continuous with dielectric strength of 20–25 kV/mm. Suitable for low-voltage applications below 1 kV, this material offers excellent retrofit capability.
Enhanced thermal stability to 125°C makes XLPE the preferred choice for medium-voltage switchgear insulation components. Shrink ratios of 2:1 or 3:1 accommodate various busbar geometries.
High-temperature tolerance reaching 180°C continuous suits environments with frequent thermal cycling. These barriers provide superior flexibility and resistance to thermal shock.
Factory-applied electrostatic coating achieves dielectric strength of 15–20 kV/mm at thicknesses of 0.3–0.5 mm. Field repair limitations make this method unsuitable for retrofit applications.
| Method | Voltage Class | Dielectric Strength | Temp Rating | Retrofit Ease | Cost |
|---|---|---|---|---|---|
| Heat shrink polyolefin | Up to 1 kV | 20–25 kV/mm | 105°C | Excellent | Low |
| Cross-linked polyolefin | Up to 36 kV | 20–30 kV/mm | 125°C | Excellent | Low-Medium |
| Silicone rubber barriers | Up to 36 kV | 18–22 kV/mm | 180°C | Good | Medium-High |
| Epoxy powder coating | Up to 15 kV | 15–20 kV/mm | 130°C | Poor | Medium |
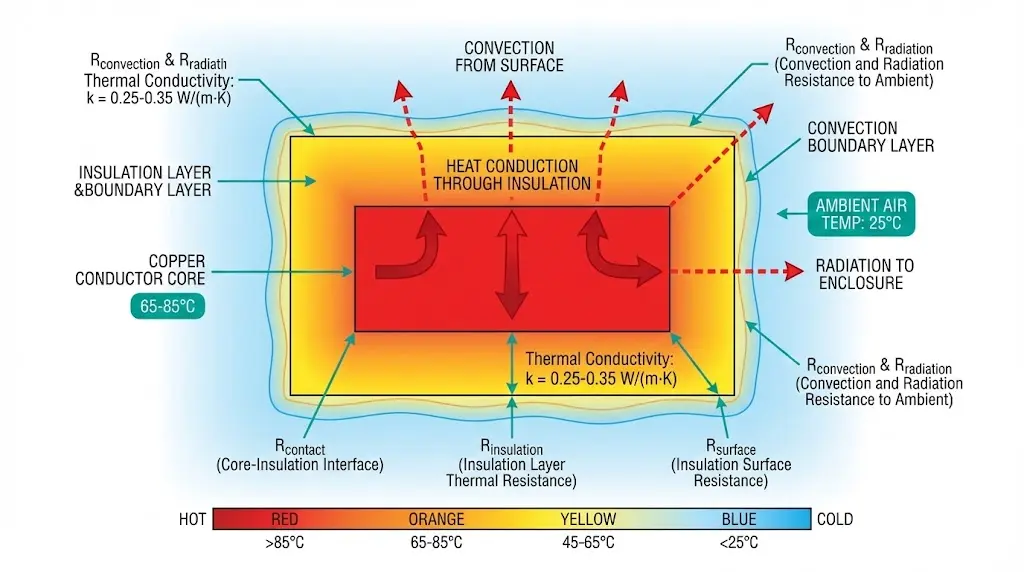
The insulation’s thermal conductivity directly affects heat dissipation. Standard polyolefin materials exhibit thermal conductivity of 0.25–0.35 W/(m·K), creating thermal resistance that impedes heat transfer. This effect, while necessary for electrical isolation, requires careful consideration during thermal design.
For medium-voltage systems, material selection must address dielectric requirements, thermal compatibility, and environmental exposure simultaneously.
According to IEC 62271-1 [VERIFY STANDARD: Table for rated insulation levels], 12 kV busbar systems require minimum air clearances of 125 mm phase-to-phase and demonstrate dielectric withstand capability of 28 kV at power frequency. Insulation materials must maintain these margins under contaminated conditions.
The relationship between temperature rise and insulation life follows the Arrhenius model: for every 10°C increase above rated temperature, insulation service life decreases by approximately 50%. A busbar system rated for 40-year service at 75°C may degrade to 10-year equivalent life if sustained at 95°C. This thermal-aging relationship directly informs infrared thermography action limits used in predictive maintenance programs.
For industrial environments classified as Pollution Degree 3, IEC 60664-1 mandates creepage distances of 12.5 mm minimum for 690 V systems, increasing to 25 mm for 1000 V applications. Post insulators for busbar support systems must meet these creepage requirements while providing mechanical stability.
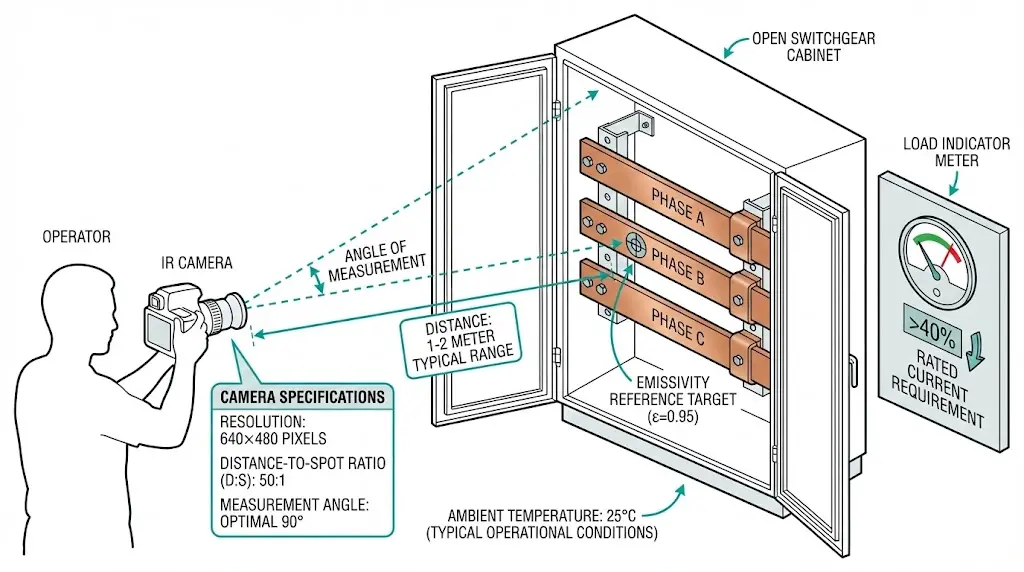
Effective thermal monitoring requires appropriate equipment and standardized survey conditions.
Resolution of 320×240 pixels provides adequate detail for general switchgear surveys; 640×480 resolution enables detection of smaller anomalies. Thermal sensitivity (NETD) below 50 mK ensures subtle temperature differentials remain visible.
Bare copper and aluminum present measurement challenges with emissivity values of 0.05–0.15. These polished surfaces reflect ambient thermal radiation, producing misleading readings. Insulated surfaces with emissivity of 0.9–0.95 provide reliable measurements. For bare conductors, apply emissivity reference targets or measure adjacent insulated sections.
Minimum load of 40% rated current is essential—below this threshold, temperature differentials may be too small to detect developing faults. Document ambient temperature and load conditions for every survey to enable meaningful trending. Distance-to-spot ratio determines the smallest detectable anomaly size at a given distance.
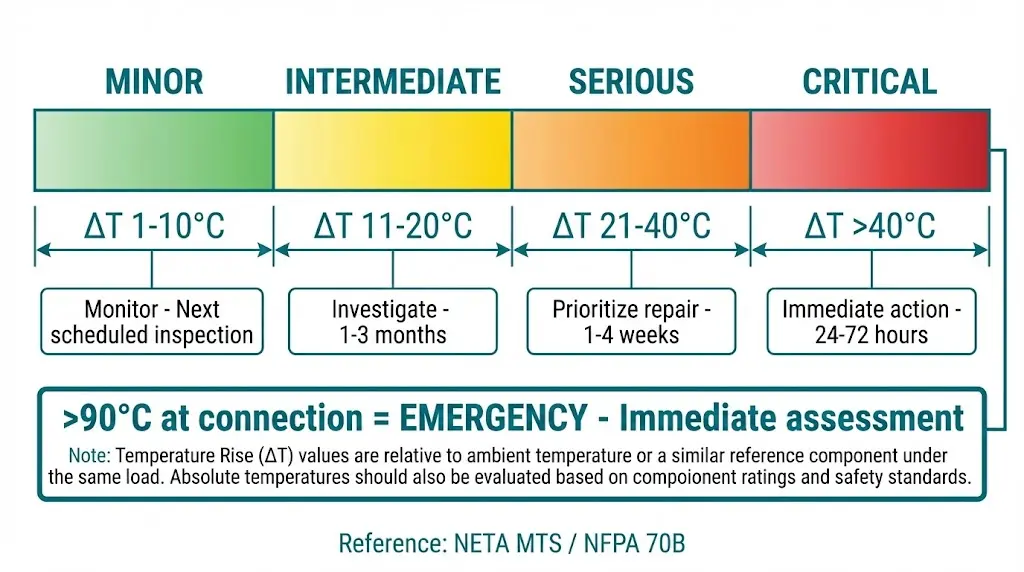
Temperature data becomes actionable only when mapped to specific response protocols. The distinction between delta-T (differential) and absolute measurements determines how severity is assessed.
ΔT compares the suspect point temperature against a reference point under identical conditions—typically the same phase connection at another location or an adjacent phase carrying similar load. This differential method compensates for varying load and ambient conditions, providing more reliable severity assessment than absolute values alone.
| ΔT Above Reference | Severity | Recommended Action | Response Timeline |
|---|---|---|---|
| 1–10°C | Minor | Document and trend | Next scheduled inspection |
| 11–20°C | Intermediate | Investigate root cause | 1–3 months |
| 21–40°C | Serious | Prioritize repair planning | 1–4 weeks |
| >40°C | Critical | Immediate intervention required | 24–72 hours |
| Absolute >90°C at connection | Emergency | Assess de-energization | Immediate |
Thresholds aligned with NETA MTS and NFPA 70B guidance. Actual limits vary based on equipment ratings and facility criticality.
High-resistance connections from loose hardware or oxidation produce localized heating at bolted joints. Overloaded conductors show elevated temperature along the entire run. Phase imbalance creates asymmetric heating patterns across the three phases. Surface heating on insulation indicates contamination tracking or internal degradation.
When inspecting vacuum circuit breaker primary connections, apply these same thresholds to the busbar-to-breaker interface points.
[Expert Insight: Practical Survey Recommendations]
- Establish baseline thermal profiles under documented load conditions within 6 months of commissioning
- Survey frequency for critical facilities: quarterly minimum; standard industrial: semi-annual
- Event-triggered surveys after any fault clearing, major load change, or connection maintenance
- Correlate thermal findings with ultrasonic partial discharge testing for comprehensive diagnostics
Proper installation technique determines whether insulation achieves its rated service life or fails prematurely.
Remove oxide layers from copper and aluminum surfaces using appropriate abrasives. Degrease with compatible solvents—residual contamination beneath sleeving creates void spaces that initiate partial discharge. Maintain minimum edge radius of 3 mm on all busbar corners to prevent insulation puncture during shrinking.
Position sleeving with minimum 25 mm overlap at joints. Apply heat from center outward to eliminate trapped air pockets. Control heat gun temperature between 120–200°C depending on material grade—excessive heat damages the polymer matrix while insufficient heat produces incomplete shrinkage. Inspect for uniform recovery, absence of bubbles, and complete adhesion.
Design enclosures with IR-transparent windows aligned to critical connection points. Calcium fluoride and zinc selenide provide excellent transmission; polymer alternatives offer lower cost with adequate performance for routine surveys. Label window locations to ensure consistent measurement points across multiple surveys.
XBRELE manufactures insulation components engineered for medium-voltage switchgear assemblies, including post insulators, wall bushings, and phase barrier systems meeting IEC and GB standards.
Our technical team provides selection support for busbar insulation requirements across voltage classes from 3.6 kV to 40.5 kV. Whether specifying new switchgear builds or sourcing replacement components for maintenance programs, contact our switchgear component specialists to discuss your project requirements.
External Reference: Insulation coordination margins used for busbar interface design can be cross-checked against IEC 60071.
What minimum load is required for accurate IR thermography of busbars?
Most standards recommend at least 40% of rated load current to produce measurable temperature differentials. Surveys at lower loads may miss developing faults because the I²R heating effect scales with current squared.
How often should IR thermal surveys be performed on switchgear busbars?
Critical facilities typically require quarterly surveys, while standard industrial installations benefit from semi-annual inspections. Additional surveys should follow any fault event, major load change, or connection maintenance work.
Why do bare copper busbars give inaccurate IR temperature readings?
Polished copper has emissivity between 0.05 and 0.15, causing the camera to read reflected ambient radiation rather than actual surface temperature. Oxidized or insulated surfaces with emissivity above 0.8 provide reliable measurements.
At what temperature should a busbar connection trigger immediate action?
Connections showing ΔT greater than 40°C above reference or absolute temperatures exceeding 90°C typically warrant immediate assessment. Exact thresholds depend on insulation thermal class and equipment ratings.
Can heat shrink sleeving be applied to energized busbars?
No—installation requires de-energized equipment with proper lockout-tagout procedures. The heat application process and need for thorough surface preparation make live work impractical and unsafe.
What causes uneven heating across three-phase busbar systems?
Phase imbalance in connected loads produces asymmetric thermal patterns. Unequal connection resistance between phases—from differential torque or oxidation—also creates temperature differences that IR surveys readily detect.
How does insulation thermal class affect temperature action limits?
Class B insulation (130°C rated) requires more conservative action thresholds than Class H (180°C rated). Apply the severity table percentages relative to your specific insulation’s continuous temperature rating rather than using absolute values universally.