Need Full Specifications?
Download our 2025 Product Catalog for detailed drawings and technical parameters of all switchgear components.
Get CatalogDownload our 2025 Product Catalog for detailed drawings and technical parameters of all switchgear components.
Get CatalogDownload our 2025 Product Catalog for detailed drawings and technical parameters of all switchgear components.
Get Catalog

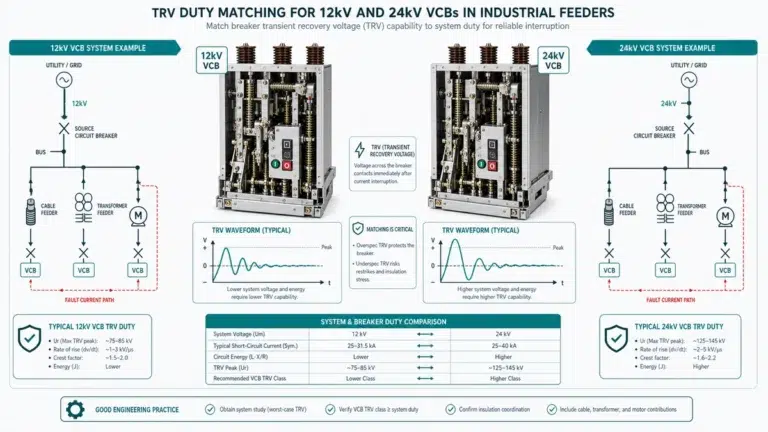
Transient Recovery Voltage (TRV) appears across circuit breaker contacts immediately after arc extinction during fault interruption. The Rate of Rise of Recovery Voltage (RRRV), measured in kV/μs, determines how quickly this stress develops. Together, these parameters dictate whether a vacuum circuit breaker clears faults successfully or suffers dielectric breakdown and restrike.
When contacts separate and the arc extinguishes at current zero, the system does not return to steady-state conditions instantly. Interaction between system inductance and capacitance generates oscillatory voltage transients. Field deployments across industrial facilities with extensive cable networks reveal TRV peak values reaching 1.5 to 2.5 times rated voltage within 50–100 μs after current zero.
The physics involves energy transfer between magnetic fields stored in system inductance and electric fields stored in cable capacitance. Per IEC 62271-100, vacuum circuit breakers rated for 12 kV must withstand TRV peaks of approximately 26.2 kV with RRRV values up to 2.0 kV/μs for terminal fault conditions. Cable-connected systems present particular challenges—the low surge impedance of cables (30–50 Ω versus 300–400 Ω for overhead lines) accelerates voltage recovery significantly.
The TRV waveshape depends on three critical factors: (1) the equivalent surge impedance Zs of the connected system, (2) the total capacitance Ctotal including cable capacitance (typically 200–300 pF/m for XLPE cables), and (3) the short-circuit inductance Lsc determining oscillation frequency. The initial RRRV can be approximated as Upeak × ω, where ω represents the natural angular frequency of the LC circuit.
The dielectric strength of the contact gap must recover faster than TRV rises. This race occurs in microseconds. Lose it, and the arc reignites.

Cable systems amplify TRV severity through their electrical characteristics. Unlike overhead lines with high surge impedance, power cables present low impedance paths that accelerate voltage transients.
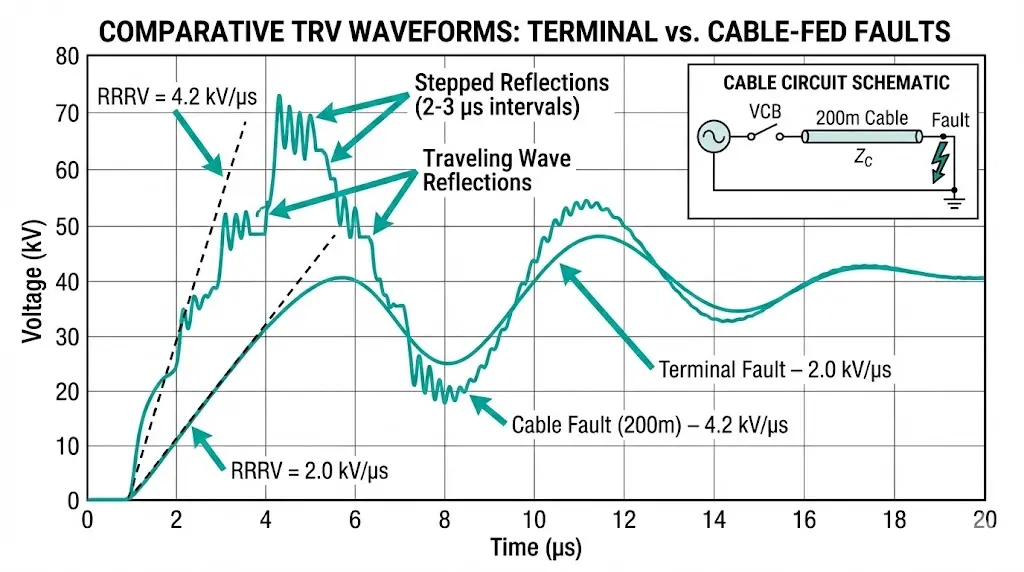
Consider a 12 kV industrial feeder with 200 meters of XLPE cable. The cable’s surge impedance sits around 40 Ω. When a fault occurs at the remote end, traveling waves reflect between the breaker and fault location. Round-trip time for these reflections: approximately 2.5 μs given cable propagation velocity of 160 m/μs. Each reflection superimposes additional voltage stress on the contact gap.
The critical cable length zone falls between 50 and 500 meters. Shorter cables produce faster reflections—sometimes before the vacuum interrupter fully recovers dielectric strength. Longer cables allow more recovery time between reflection arrivals.
Factors that worsen cable TRV:
Field experience from motor feeder installations reveals a consistent pattern: breakers rated adequately for terminal faults experience marginal performance when protecting cable runs under 300 meters with fault currents exceeding 15 kA. The RRRV in these applications routinely reaches 3–5 kV/μs—well above standard T100 test duty requirements of 2.0 kV/μs.
Worked Example: Industrial MCC Feeder
A 12 kV vacuum breaker feeds a motor control center through 150 m of single-core XLPE cable:
Calculated initial RRRV: approximately 4.2 kV/μs
This exceeds the IEC 62271-100 T100 requirement. The breaker’s T30 capability (5.0 kV/μs) provides margin, but only if actual fault current aligns with that test duty range.
[Expert Insight: Cable TRV Assessment]
- Measure actual cable lengths precisely—assumptions based on drawings often underestimate installed routing
- Request manufacturer TRV capability curves spanning the full RRRV range, not just standard test duty compliance
- For parallel cable runs, calculate combined surge impedance (parallel impedance formula applies)
- Motor starting transients do not create TRV stress; focus analysis on fault interruption scenarios
Capacitor switching inverts the normal TRV concern. The danger lies not in fault interruption but in load switching—specifically, the restrike phenomenon during de-energization.
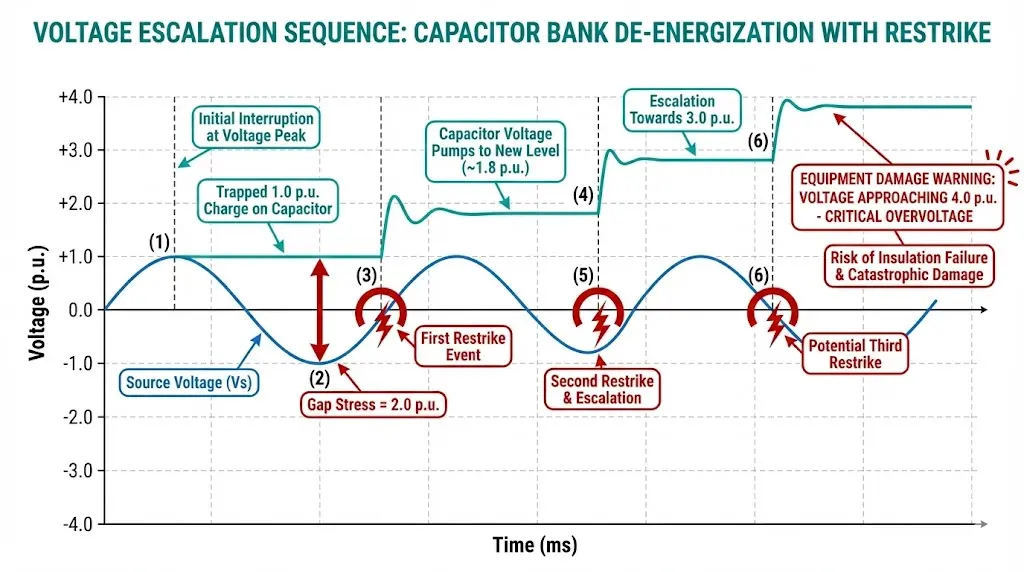
When a vacuum breaker opens to disconnect a capacitor bank, current leads voltage by 90 degrees. Interruption occurs near voltage peak. The capacitor retains this peak charge. As source voltage swings through zero and toward opposite polarity, the contact gap sees nearly 2.0 per-unit voltage stress within one half-cycle.
The TRV rises slowly compared to fault interruption—RRRV remains modest. But the peak value challenges the gap’s withstand capability at precisely the wrong moment: before the contacts have fully separated.
If the gap breaks down (restrikes), current flows briefly until the next zero crossing. Now the capacitor voltage has shifted. The gap clears again, but voltage across it has escalated. Successive restrikes pump the voltage higher: 2.0 p.u., then 3.0 p.u., potentially 4.0 p.u. or beyond. Equipment insulation fails. Surge arresters operate. Capacitor units rupture.
Class C1 versus Class C2 Ratings
IEC 62271-100 defines capacitor switching classes:
| Class | Restrike Requirement | Application Suitability |
|---|---|---|
| C1 | Low probability of restrike | General switching duty |
| C2 | Very low probability (essentially zero) | Capacitor bank duty mandatory |
Class C2 certification requires passing a 56-operation test sequence at rated capacitive current with voltage monitoring. Any restrike constitutes failure. For capacitor bank applications, specifying Class C2 is non-negotiable.
Modern vacuum interrupters with CuCr contact materials achieve Class C2 performance reliably. The consistent dielectric recovery of vacuum technology—independent of capacitive current magnitude—provides inherent advantages. However, vacuum circuit breaker manufacturers must explicitly design and test for this duty. Generic vacuum breakers may carry only C1 ratings.
Back-to-Back Capacitor Switching
When energizing a capacitor bank with other banks already connected, inrush current from the charged banks into the uncharged bank creates additional stress. This phenomenon differs from TRV but often gets conflated in specifications. The concern here is contact welding from high-frequency inrush, not dielectric recovery failure.
Not every cable circuit or capacitor installation requires special attention. The severity factor approach provides a quantitative screening method.
Severity Factor Calculation
SF=RRRVstandard/RRRVactual×Ucstandard/Ucactual
Interpretation thresholds:
Data Requirements for Proper Assessment
Accurate TRV analysis requires:
For critical applications—generating stations, large industrial facilities, utility substations—electromagnetic transient (EMT) simulation provides definitive TRV characterization. Software packages model traveling wave reflections, transformer frequency response, and actual breaker current-chopping behavior.
Practical Shortcut
When EMT simulation is impractical, engage the breaker manufacturer’s application engineering team. Provide single-line diagrams, cable data sheets, and fault study results. Reputable manufacturers offer TRV capability verification as part of technical sales support—particularly for projects requiring detailed specification guidance.
[Expert Insight: When to Demand Detailed TRV Analysis]
- Any installation with cables under 300 m and fault current above 70% of breaker rating
- All capacitor bank switching applications regardless of bank size
- Generator step-up applications where source impedance varies with machine loading
- Retrofits replacing oil or SF6 breakers where original TRV margins are unknown
- Repeated breaker failures during specific switching operations (pattern suggests TRV issue)
Three approaches address severe TRV conditions: enhanced breaker capability, external mitigation devices, or system reconfiguration.
Manufacturers offer vacuum circuit breakers with improved TRV performance through:
Request TRV capability curves showing the RRRV versus Uc envelope the breaker can withstand—not merely compliance statements referencing standard test duties. The curve should span from T100 through T10 equivalent conditions.
External components modify the TRV waveform:
Shunt capacitors (0.1–0.5 μF): Connected across breaker terminals, these provide a local charge reservoir that reduces initial RRRV. The capacitor charges through the system impedance, slowing voltage rise. Common in generator circuit breaker applications. Requires coordination—the capacitor itself must withstand the TRV and may affect breaker operating mechanism timing.
Surge arresters: Metal-oxide arresters limit TRV peak but do not reduce RRRV. Useful when peak TRV exceeds capability but rate of rise remains acceptable.
Opening resistors: Highly effective but rarely applied at medium voltage due to cost and mechanical complexity.
Sometimes modifying the installation proves more economical than specifying special breakers:

| Parameter | Standard Requirement | Enhanced Requirement |
|---|---|---|
| RRRV capability | Per IEC 62271-100 test duty | Actual system RRRV + 20% margin |
| Peak TRV (Uc) | Class-rated value | System study result + 15% margin |
| Capacitor switching class | C1 acceptable for general duty | C2 mandatory for capacitor banks |
| Cable charging current | Rated value stated | Actual capacitive current + growth allowance |
| Test documentation | Type test certificate | Application-specific TRV verification report |
Recognizing TRV-related stress in operating breakers allows intervention before failure.
Diagnostic Indicators
Maintenance Priorities
For breakers in TRV-critical applications:
Understanding environmental factors affecting vacuum circuit breaker selection supports maintenance planning for outdoor installations where contamination and temperature extremes compound TRV concerns.
Case Example: Industrial Capacitor Bank Failures
A 12 kV, 15 Mvar capacitor bank installation experienced three breaker failures over 18 months. Investigation revealed:
Solution: Replacement with Class C2 vacuum breaker plus pre-insertion resistor for additional margin during energization transients.
XBRELE vacuum circuit breakers incorporate Class C2 capacitor switching capability as standard across the product range. Our application engineering team provides TRV assessment support for cable and capacitor installations—ensuring specification accuracy before procurement.
For non-standard applications, custom TRV capability verification testing can be arranged through our manufacturing facility. Documentation packages include type test certificates with detailed TRV envelope data mapping actual capability against your system requirements.
Understanding vacuum interrupter fundamentals helps engineers evaluate how XBRELE’s design approach delivers the dielectric recovery performance that severe TRV applications demand.
Contact our technical team for application-specific TRV analysis and vacuum circuit breaker selection guidance.
External Reference: IEC 60071 — IEC 60071 insulation coordination
What RRRV value indicates a vacuum circuit breaker needs enhanced TRV specification?
For 12 kV applications, RRRV exceeding 5 kV/μs at the actual fault current level warrants manufacturer consultation; values approaching 7 kV/μs generally require either enhanced breaker designs or external TRV mitigation devices.
Why do cables between 50 and 500 meters create particularly severe TRV conditions?
This length range produces traveling wave round-trip times of 0.6–6 μs, causing voltage reflections to arrive at the breaker contacts before the vacuum gap fully recovers dielectric strength after arc extinction.
How does Class C2 capacitor switching differ from Class C1 in practical terms?
Class C2 requires essentially zero restrikes across a standardized 56-operation test sequence, while Class C1 permits a statistically low restrike probability; only C2 provides the performance margin capacitor bank applications require.
Can adding capacitors across breaker terminals reduce TRV severity on existing installations?
Shunt capacitors of 0.1–0.5 μF can effectively reduce initial RRRV by providing local charge storage, though this requires manufacturer coordination to verify the capacitor withstands the transient and does not affect breaker timing.
What symptoms suggest a breaker is experiencing TRV-related stress in service?
Asymmetric contact erosion patterns, failures occurring specifically during capacitor de-energization or cable fault clearing rather than randomly, and captured transient overvoltages during switching operations all indicate potential TRV inadequacy.
How does vacuum technology compare to SF6 for severe TRV applications?
Vacuum interrupters typically achieve dielectric recovery within 5–15 μs after current zero—faster than SF6 technology—providing inherent advantages in high-RRRV applications common to cable-fed circuits at medium voltage ratings.
When should electromagnetic transient simulation be required for TRV analysis?
EMT simulation is warranted for generating station applications, installations with fault currents exceeding 80% of breaker rating combined with short cable runs, and any situation where multiple breaker failures suggest unidentified TRV issues.