Need Full Specifications?
Download our 2025 Product Catalog for detailed drawings and technical parameters of all switchgear components.
Get CatalogDownload our 2025 Product Catalog for detailed drawings and technical parameters of all switchgear components.
Get CatalogDownload our 2025 Product Catalog for detailed drawings and technical parameters of all switchgear components.
Get Catalog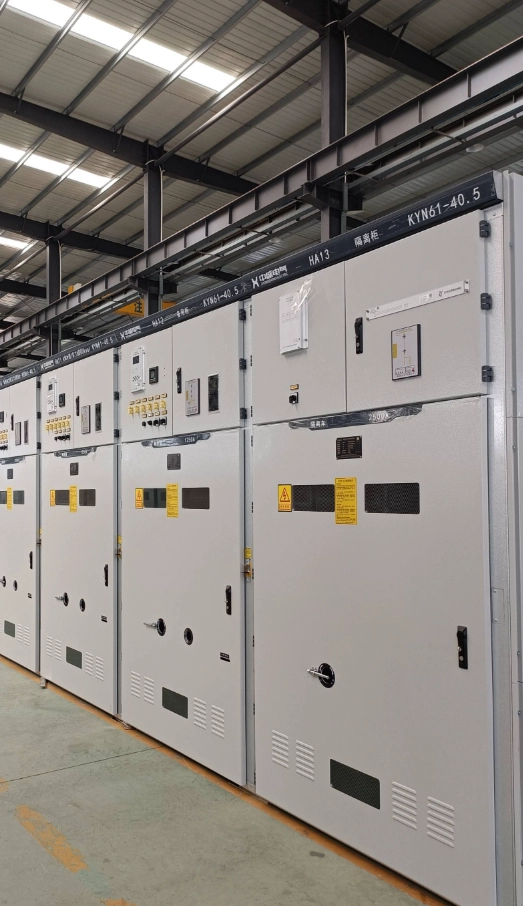
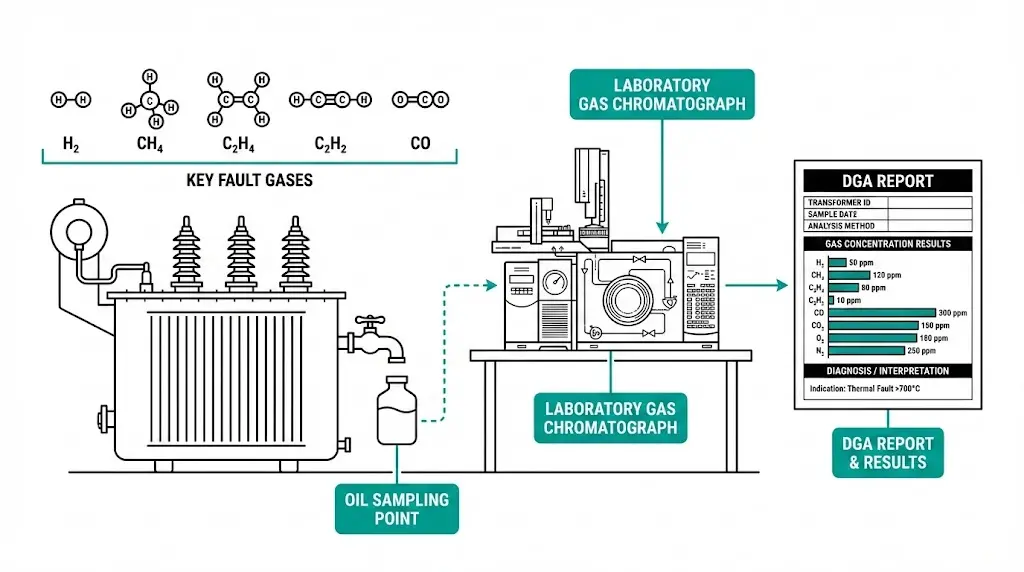
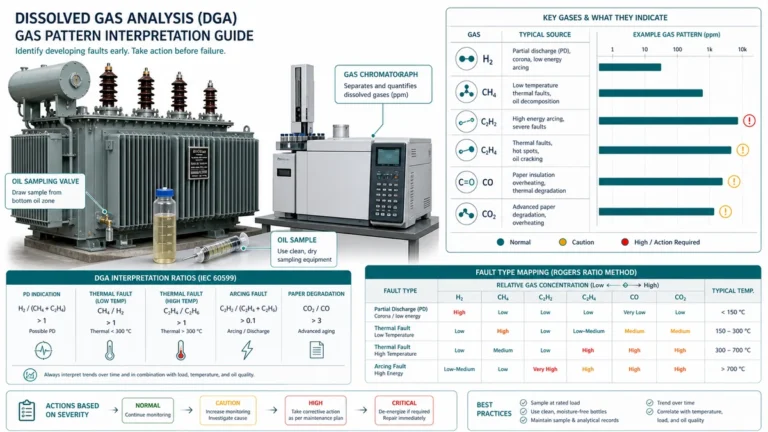
Dissolved Gas Analysis (DGA) detects and quantifies gases dissolved in transformer insulating oil to identify developing faults before catastrophic failure occurs. When transformer oil and cellulose insulation experience abnormal stress—whether from overheating, arcing, or partial discharge—molecular bonds break down and release characteristic gases that create a diagnostic fingerprint for maintenance engineers.
In field deployments across 200+ power transformers ranging from 35 kV to 500 kV, DGA has consistently provided the earliest warning of developing faults—often 6 to 18 months before conventional diagnostic methods detect anomalies. This lead time transforms reactive maintenance into planned interventions.
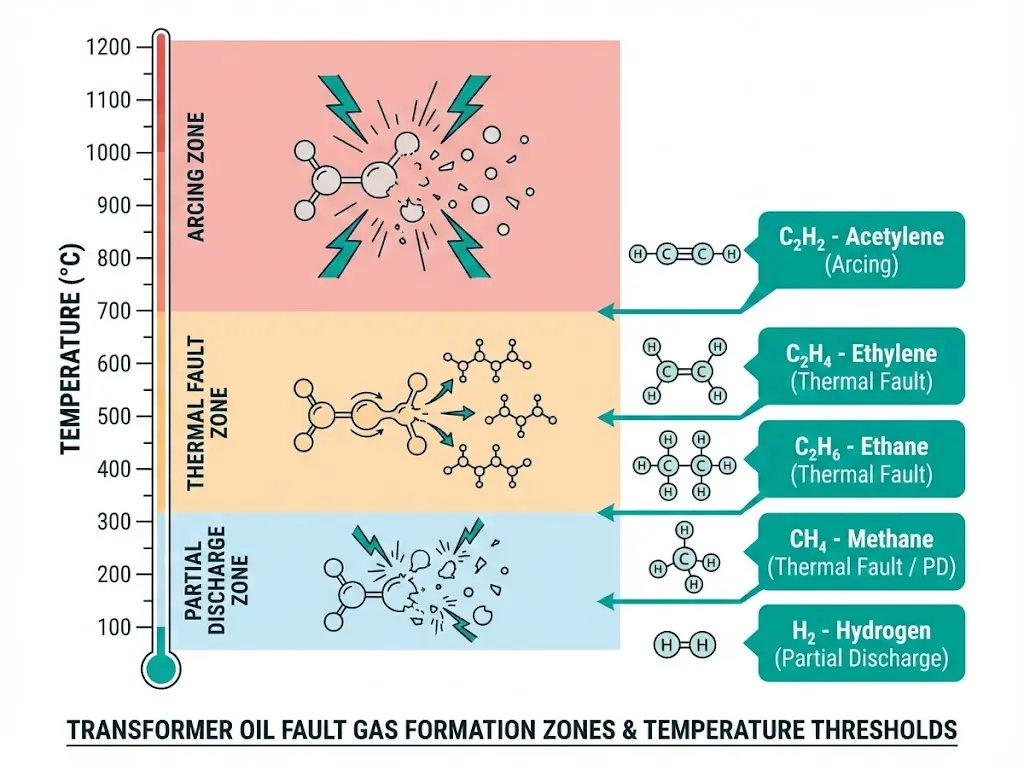
The physics underlying DGA centers on thermal and electrical decomposition of insulating materials. Different energy levels break different chemical bonds, which explains why each fault type produces a distinct gas signature.
At temperatures below 300°C, oil decomposition primarily generates hydrogen (H₂) and methane (CH₄). Partial discharge activity—low-energy electrical faults occurring in gas voids or at oil-paper interfaces—drives hydrogen formation at these relatively modest temperatures. Testing across medium-voltage distribution transformers shows hydrogen generation rates of 50–200 ppm/year often indicate developing partial discharge without immediate failure risk.
As thermal stress increases to 500–700°C, ethylene (C₂H₄) becomes the dominant hydrocarbon. Localized hot spots from circulating currents, blocked cooling passages, or deteriorating connections create conditions for ethylene formation. When ethylene concentrations exceed 100 ppm with rapid generation rates, immediate investigation becomes necessary.
Acetylene (C₂H₂) requires arc temperatures exceeding 700°C for significant formation. Even trace concentrations of 2–5 ppm warrant investigation, as acetylene rarely appears during normal transformer operation. This gas serves as the definitive marker for high-energy electrical faults.
Carbon monoxide (CO) and carbon dioxide (CO₂) result from cellulose degradation in paper insulation rather than oil breakdown. The CO₂/CO ratio provides insight into degradation severity: ratios below 3 typically suggest accelerated aging requiring intervention, while ratios above 7 indicate normal thermal aging.
Oxygen and nitrogen levels, though not fault gases themselves, reveal conservator and seal integrity. Elevated oxygen accelerates oil oxidation and sludge formation, compounding other degradation mechanisms.
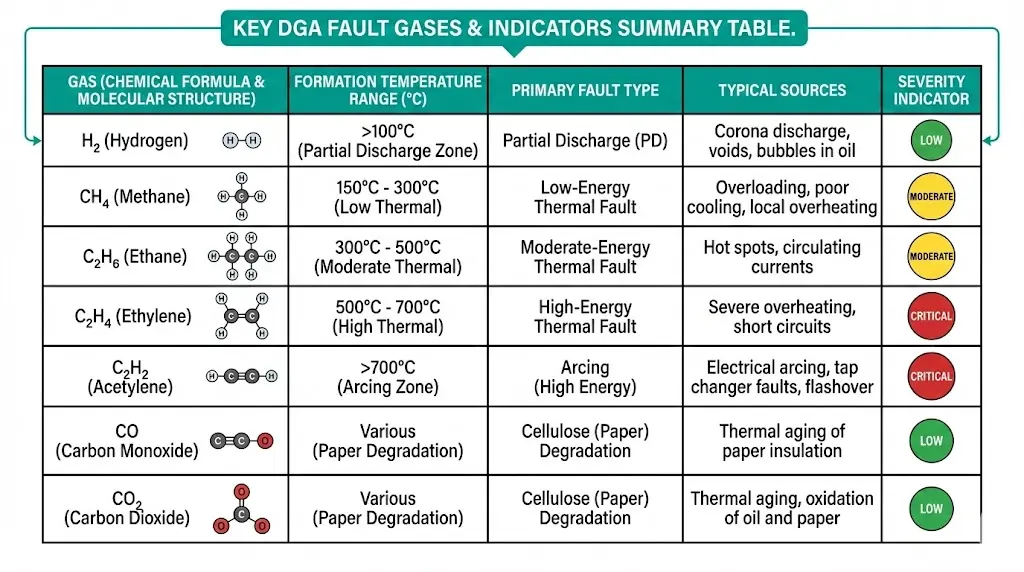
Each dissolved gas tells a specific story about internal transformer conditions. Understanding these signatures enables precise fault identification.
Hydrogen (H₂) forms at the lowest fault energies, typically above 150°C. Primary sources include partial discharge in oil or at oil-paper interfaces, corona discharge in gas pockets, and low-energy sparking from floating potentials. Field experience shows aging porcelain bushings often produce gradual hydrogen increases from corona at degraded capacitive grading layers.
Methane (CH₄) indicates thermal decomposition between 150–300°C. Common sources include circulating currents in core laminations, poor joints in core ground straps, and minor connection overheating. Methane alone rarely signals urgent problems but warrants monitoring.
Ethane (C₂H₆) appears at moderate thermal stress between 300–500°C. Sources overlap with methane but at higher intensities—blocked cooling ducts, deteriorating tap changer contacts under load, and localized winding hot spots.
Ethylene (C₂H₄) requires temperatures of 500–700°C, indicating severe overheating. Overheated conductors, shorted core laminations, and failing bushing connections generate substantial ethylene. Rising ethylene trends demand serious investigation regardless of absolute concentration.
Acetylene (C2H2) represents the most critical fault gas, forming only at temperatures above 700°C—conditions associated with arcing faults and high-energy discharges. Even trace concentrations of 2–5 ppm warrant investigation, as acetylene rarely appears during normal operation.
Carbon Monoxide (CO) and Carbon Dioxide (CO₂) signal cellulose degradation specifically. Paper insulation thermal aging produces both gases, with the ratio indicating severity. Rapidly rising CO levels—particularly exceeding 50 ppm/month—suggest accelerating paper deterioration that shortens transformer life expectancy.
Oxygen (O₂) and Nitrogen (N₂) indicate atmospheric exposure. Sealed transformers should maintain oxygen below 3,000 ppm. Elevated oxygen accelerates oxidation, creating acidic byproducts that attack paper insulation.
[Expert Insight: Gas Interpretation Pitfalls]
- Load tap changers (LTCs) with arcing contacts sharing main tank oil produce acetylene during normal switching—always verify LTC type before interpreting C₂H₂ data
- Stray gassing from certain oil types can produce hydrogen and methane without actual faults; establish baselines for specific oil brands
- Recent oil processing (degassing, filtering) temporarily suppresses gas levels, potentially masking developing faults
- Overheating from external sources (solar exposure on exposed tanks) can generate thermal gases unrelated to internal faults
Three primary methods transform raw gas concentrations into fault diagnoses. Each offers distinct advantages depending on fault complexity.
Key Gas Method provides the fastest field assessment by identifying which single gas shows the highest concentration or fastest rise rate. Dominant hydrogen suggests partial discharge. Dominant ethylene points to severe thermal faults. Dominant acetylene indicates arcing. This method works well for clear-cut cases but struggles with mixed fault signatures where multiple degradation mechanisms operate simultaneously.
Rogers Ratios use mathematical relationships between gas pairs—CH₄/H₂, C₂H₆/CH₄, C₂H₄/C₂H₆, and C₂H₂/C₂H₄—to classify faults into predefined codes. The systematic approach reduces interpretation subjectivity. However, Rogers Ratios frequently produce “no diagnosis” results when ratios fall outside defined boundaries, a common occurrence with incipient or mixed faults.
Duval Triangle plots relative percentages of methane, ethylene, and acetylene on triangular coordinates. Seven zones within the triangle correspond to specific fault types:
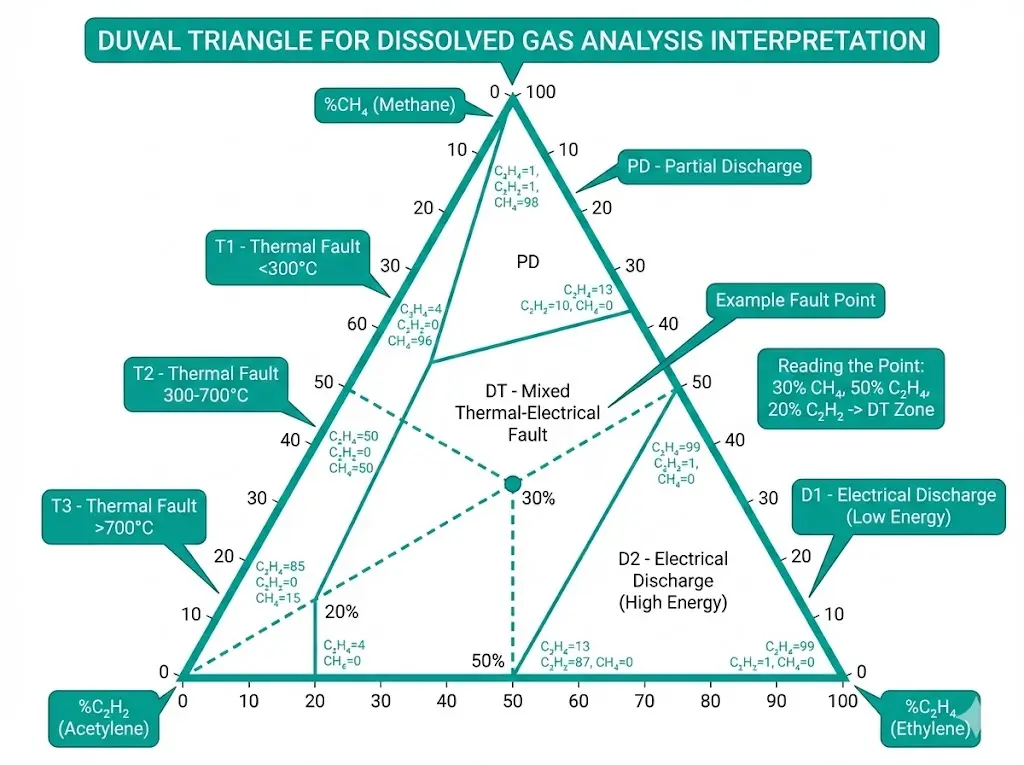
The Duval method handles mixed faults better than ratio methods and sees wide utility acceptance. Extensions including Duval Triangle 4, Triangle 5, and the Pentagon address specific equipment like load tap changers and shunt reactors.
IEEE C57.104-2019 emphasizes absolute concentration levels with a four-tier condition status (Condition 1–4), while IEC 60599 focuses on gas ratios and typical concentration ranges. Most utilities apply hybrid approaches—using IEC ratio methods for fault identification combined with IEEE-style absolute thresholds for alarm triggering.
| Method | Best Application | Primary Limitation |
|---|---|---|
| Key Gas | Quick field screening | Misses mixed faults |
| Rogers Ratios | Systematic classification | Frequent “no diagnosis” results |
| Duval Triangle | Mixed fault identification | Requires three-gas data minimum |
| IEEE C57.104 | Absolute threshold alarms | Less fault-type specificity |
| IEC 60599 | Ratio-based diagnosis | Requires interpretation experience |
Laboratory DGA results mean little without context-appropriate alarm levels. The following framework reflects common utility practice for mineral oil transformers, though specific thresholds vary by voltage class, age, and asset criticality.
| Gas | Normal (ppm) | Caution (ppm) | Warning (ppm) | Critical (ppm) |
|---|---|---|---|---|
| H₂ | <100 | 100–200 | 200–500 | >500 |
| CH₄ | <50 | 50–100 | 100–150 | >150 |
| C₂H₆ | <30 | 30–60 | 60–100 | >100 |
| C₂H₄ | <50 | 50–100 | 100–200 | >200 |
| C₂H₂ | <2 | 2–10 | 10–35 | >35 |
| CO | <500 | 500–700 | 700–1,000 | >1,000 |
| CO₂ | <5,000 | 5,000–8,000 | 8,000–12,000 | >12,000 |
These values represent general guidance for transformers ≤69 kV. Transmission-class units often use tighter thresholds.
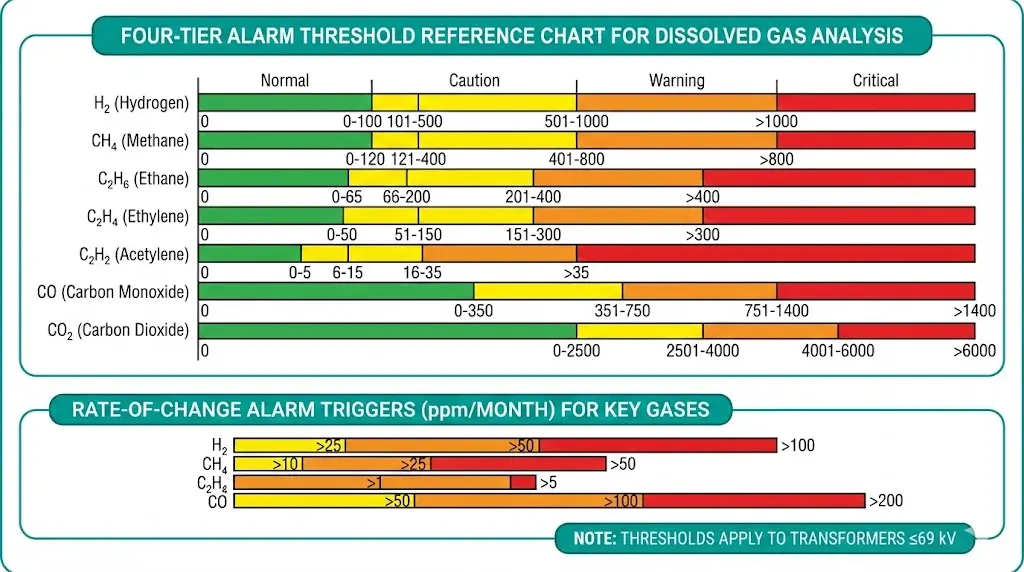
Absolute concentrations tell only part of the story. Gas generation rate often provides earlier warning:
Trending requires consistent sampling intervals. Critical transformers typically warrant quarterly sampling; distribution transformers may use annual intervals. Online DGA monitors justify their cost on critical units where early detection prevents failures worth millions in replacement costs and lost production.
Standard thresholds require adjustment for:
Engineers specifying new oil-filled equipment benefit from understanding DGA fundamentals when evaluating options from a distribution transformer manufacturer. Baseline oil quality and design choices—winding temperature rise class, cooling system efficiency, insulation materials—directly influence long-term gas generation profiles.
[Expert Insight: Alarm Logic in Practice]
- Never trigger alarms on single-sample exceedances; require confirmation sampling within 2–4 weeks
- Rate-of-change alarms catch fast-developing faults that haven’t yet crossed absolute thresholds
- Fleet normalization—comparing individual units against population averages—identifies outliers even when all units fall within “normal” ranges
- Document alarm responses and outcomes to refine thresholds based on actual fault correlation
Sample quality determines diagnostic value. Contaminated or improperly handled samples yield misleading results that can trigger unnecessary interventions or miss genuine faults.
Pre-sampling preparation: Flush the sampling valve with 200–500 mL of oil before collecting the analysis sample. This purges stagnant oil and valve contamination. Use gas-tight glass syringes or metal containers designed for DGA sampling—plastic containers allow gas permeation.
Air exposure minimization: Complete the sampling process quickly. Air dissolved into the sample during collection artificially elevates oxygen and nitrogen readings while potentially diluting fault gas concentrations. Fill containers completely, eliminating headspace.
Shipping and storage: Ship samples within 24–48 hours of collection. Extended storage allows continued gas evolution and atmospheric exchange. Temperature extremes during shipping can alter gas solubility equilibria.
Baseline establishment: New transformers should have baseline DGA within 3–6 months of energization. This captures initial gas levels before service stress accumulates and provides reference points for future trending.
Online monitoring integration: Continuous DGA monitors using photo-acoustic spectroscopy or thermal conductivity detection achieve detection limits of 1–5 ppm with hourly or daily measurement cycles. These systems excel at capturing transient fault conditions that batch sampling might miss between quarterly tests. Integration with SCADA enables automated alarming and trend visualization.
For facilities managing both oil-filled transformers and upstream switching equipment, the diagnostic discipline required for effective DGA extends naturally to understanding maintenance requirements for medium-voltage protection devices. Oil-free technologies like those from a vacuum circuit breaker manufacturer eliminate dissolved gas concerns in switching equipment while providing reliable transformer protection.
DGA results rarely stand alone in comprehensive condition assessment. Cross-referencing gas data with other diagnostic methods improves fault localization and intervention decisions.
Oil quality tests complement DGA by assessing insulation integrity from different angles. Moisture content affects dielectric strength and accelerates paper aging—correlate elevated moisture with CO/CO₂ trends indicating paper degradation. Acidity (neutralization number) reveals oxidation byproduct accumulation. Interfacial tension drops as oil degrades, tracking with thermal stress indicators.
Electrical tests localize faults that DGA detects. Winding resistance measurements identify connection problems suggested by thermal gas signatures. Power factor testing reveals insulation contamination or moisture. Turns ratio verification confirms winding integrity when DGA shows potential inter-turn fault signatures.
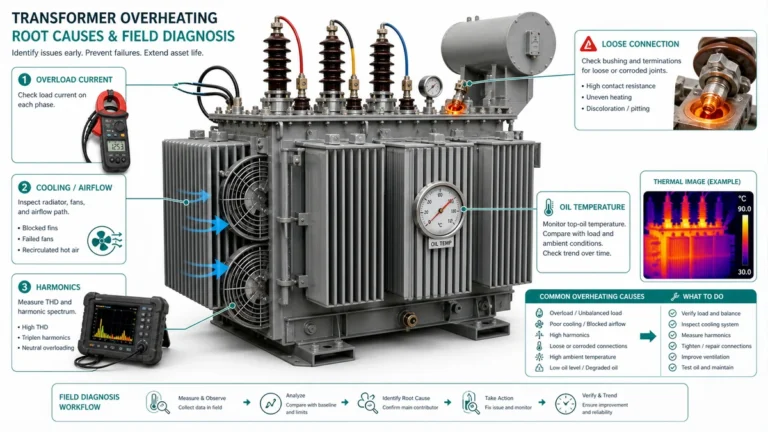
Thermal imaging during operation identifies external hot spots—loose connections, blocked radiators, cooling system deficiencies—that contribute to thermal gas generation. Correlating thermographic findings with DGA trends pinpoints root causes.
Ultrasonic partial discharge detection validates hydrogen-dominant DGA results by confirming active PD sources. Acoustic methods can sometimes localize discharge activity to specific bushings, tap changers, or winding regions.
Understanding the physics of fault detection in transformers builds diagnostic intuition applicable across power equipment. The principles underlying vacuum interrupter operation—contact separation, arc extinction, dielectric recovery—represent analogous diagnostic challenges in switching equipment where different measurement techniques apply.
Building a holistic condition assessment program means establishing correlations between diagnostic methods for your specific transformer fleet. Over time, patterns emerge: certain gas signatures reliably predict specific electrical test anomalies, particular oil quality trends precede gas generation changes, and thermal imaging findings explain otherwise puzzling DGA results.
External Reference: IEC 60076 — IEC 60076 power transformer standards
Annual sampling suits most distribution transformers operating under normal conditions, though units showing elevated gas levels or experiencing frequent overloads may warrant quarterly monitoring until trends stabilize.
Online monitors excel at continuous trending and capturing transient events but typically measure fewer gases than full laboratory analysis; most utilities use online monitoring for critical units while maintaining periodic laboratory confirmation.
Hydrogen provides the earliest warning of developing problems due to its low formation temperature, though acetylene—even at trace levels—demands the most urgent response because it indicates active arcing.
Older transformers accumulate background gas levels from cumulative thermal aging; interpretation should compare current values against unit-specific historical trends rather than generic population thresholds alone.
Oil processing (degassing, filtration, reclamation) temporarily suppresses dissolved gas levels; post-processing samples establish new baselines, and any rapid gas increase afterward may indicate that processing exposed previously masked fault activity.
Natural ester fluids produce different gas generation patterns than mineral oil, with generally higher stray gassing and different temperature-gas correlations; interpretation requires ester-specific guidance rather than standard mineral oil thresholds.
DGA reliably identifies active degradation mechanisms but cannot precisely predict remaining life; furan analysis (measuring paper degradation byproducts) combined with DGA trending provides better life estimation than either method alone.