Need Full Specifications?
Download our 2025 Product Catalog for detailed drawings and technical parameters of all switchgear components.
Get CatalogDownload our 2025 Product Catalog for detailed drawings and technical parameters of all switchgear components.
Get CatalogDownload our 2025 Product Catalog for detailed drawings and technical parameters of all switchgear components.
Get Catalog
Transformer efficiency directly determines total cost of ownership (TCO), making no-load losses (P0) and load losses (Pk) the most critical parameters when comparing manufacturer quotes. Purchase price typically represents only 15–25% of lifetime costs, while energy losses account for 60–75% of TCO for transformers operating near rated capacity over a 25–30 year service life.
Understanding these two loss categories—and how they interact with your specific load profile—transforms raw specification data into actionable economic comparisons.
No-load losses (P0), also called core losses or iron losses, occur continuously whenever a transformer remains energized—regardless of connected load. The moment voltage is applied, the core’s magnetic field begins cycling through magnetization and demagnetization 50 or 60 times per second. Two phenomena drive P0:
P0 stays essentially constant from energization until disconnection—8,760 hours per year for continuously energized units. For a typical 1,000 kVA oil-immersed power distribution transformer, P0 values range from 1,100 W to 1,800 W depending on core material grade.
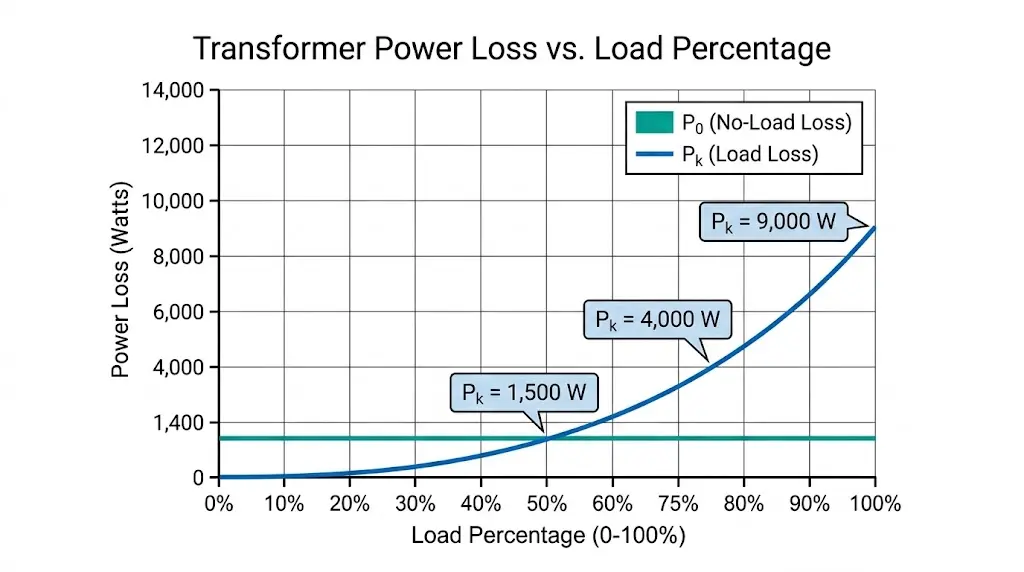
Load losses (Pk), measured at rated current, comprise I²R losses in windings and stray losses in structural components. Unlike P0, these losses vary dramatically with loading conditions. The dominant component follows the I²R relationship: double the load current, and I²R losses quadruple. A transformer operating at 75% load experiences only 56.25% of its rated Pk value.
Standard testing per IEC 60076-1 measures Pk at rated current and reference temperature (75°C for oil-immersed units), with typical values of 10,000–13,000 W for 1,000 kVA distribution transformers.
The economic significance becomes clear when calculating annual energy costs. A transformer with P0 = 1,200 W operating 8,760 hours annually consumes 10,512 kWh regardless of loading—a permanent operational expense that compounds over decades.
Consider two competing quotes for a 1,000 kVA unit:
Quote A appears $4,600 cheaper. But at $0.085/kWh over 20 years, the P0 difference alone (630 W × 8,760 hours × 20 years × $0.085) adds approximately $9,400 to Quote A’s lifetime cost. Factor in Pk differences at typical industrial loading, and Quote B saves over $6,500 in total evaluated cost despite its higher purchase price.
In our assessments across 200+ distribution transformer installations, we’ve consistently observed this pattern: buyers focusing solely on acquisition cost often select units that cost 40–60% more over their operational lifetime.
[Expert Insight: Field Procurement Observations]
- Procurement teams increasingly require lifecycle cost justification, not just capex approval
- A 500 W difference in P0 translates to $350–500/year at typical industrial rates
- Transformers with 3–7 year loss payback periods routinely outperform “budget” alternatives over 25-year service life
- Request guaranteed loss values, not “typical” or “estimated” figures—only guaranteed values carry contractual weight
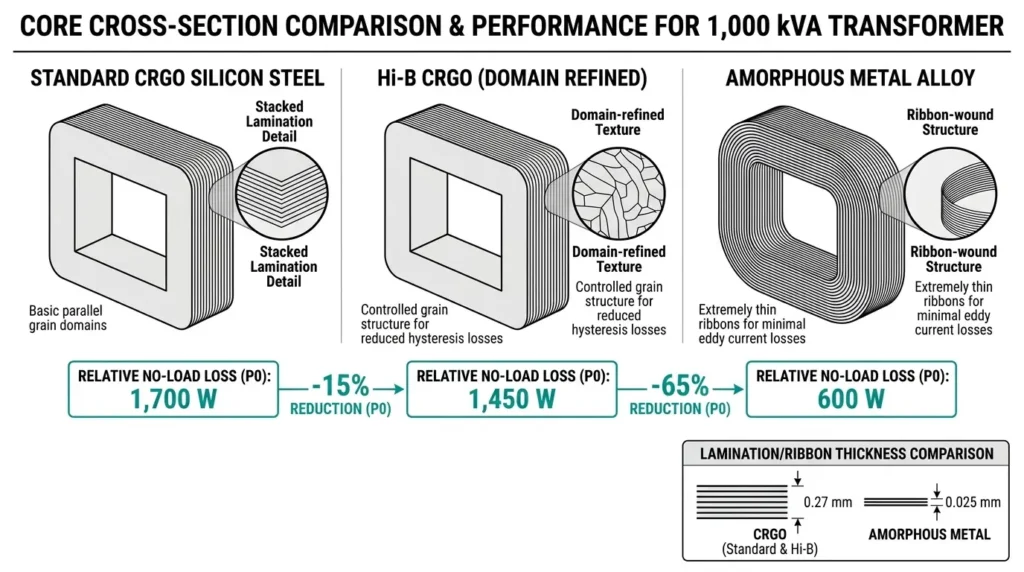
Core material selection directly impacts P0 magnitude. The differences are substantial:
Core Materials and P0:
Amorphous alloy transformers achieve dramatic P0 reductions but may show slightly higher Pk due to core geometry constraints affecting winding design.
Winding Materials and Pk:
The optimal material combination depends on your load profile. Amorphous cores excel in low load factor applications where P0 dominates. Premium CRGO with copper windings suits high load factor operations where Pk savings justify the material cost premium.
Professional procurement uses capitalized loss factors to convert watts into present-value currency, enabling objective quote comparison regardless of price/loss trade-offs.
Factor A (No-Load Loss Capitalization):
Factor A represents the present value of 1 W of continuous losses over the evaluation period:
A = Electricity Rate ($/kWh) × 8,760 hrs/year × Present Worth Factor
Present Worth Factor = (1 − (1+r)−n) / r
Where r = discount rate, n = evaluation years
Example: At $0.085/kWh, 20-year evaluation, 6% discount rate → A ≈ $8.56/W
Factor B (Load Loss Capitalization):
Factor B accounts for the load-dependent nature of Pk:
B = A × (Load Factor)² × Responsibility Factor
The load factor is squared because Pk varies with I². Responsibility factor (typically 0.8–1.0) accounts for peak coincidence with system demand.
Example: Load factor 0.55, responsibility factor 0.85 → B ≈ $2.20/W
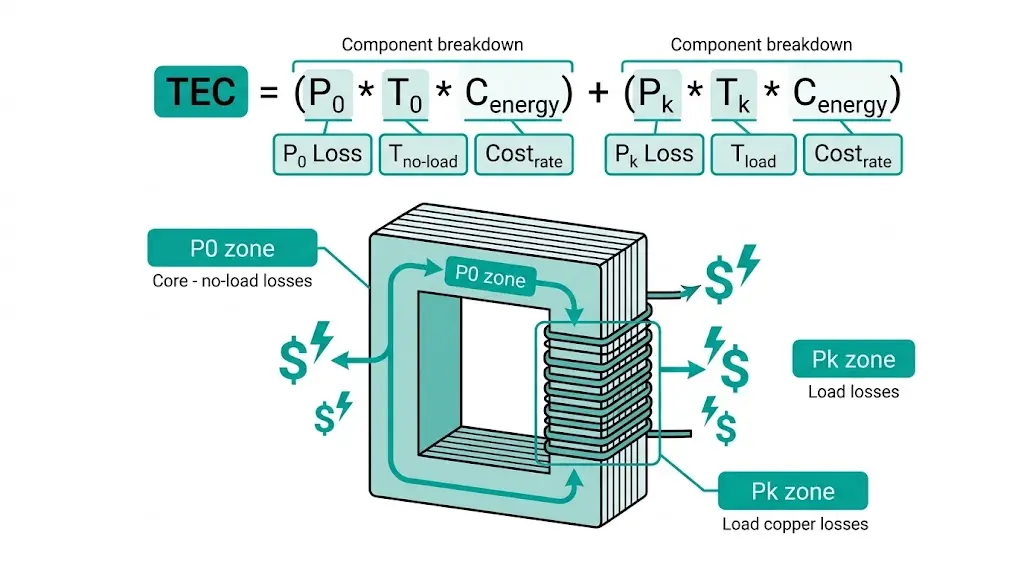
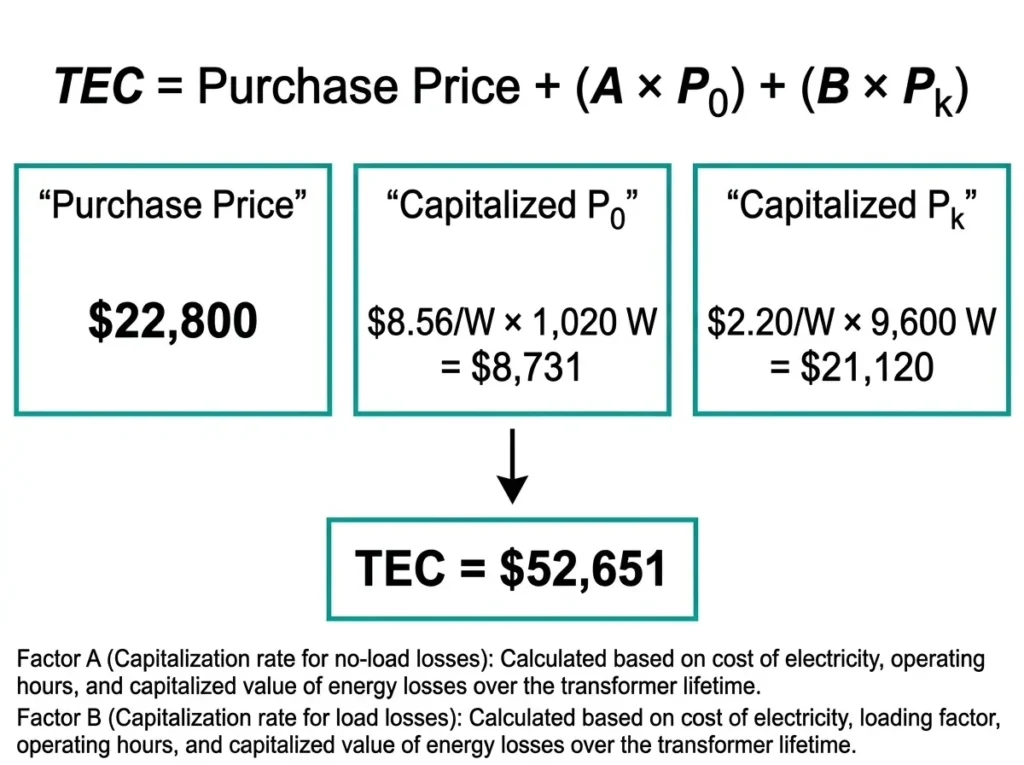
Total Evaluated Cost (TEC):
TEC = Purchase Price + (A × P0) + (B × Pk)
Lowest TEC indicates best lifecycle value. This method transforms subjective “is the premium worth it?” discussions into quantifiable comparisons.
Load profile fundamentally shifts which loss category dominates your TCO calculation.
High Load Factor Operations (>0.70):
Data centers, continuous process plants, and base-load industrial facilities see Pk dominate the TEC equation. Factor B remains significant because the transformer operates near rated capacity for extended periods. Priority: minimize load losses even if P0 runs slightly higher.
Low Load Factor Operations (<0.40):
Distribution feeders, residential substations, and seasonal facilities find P0 dominant. The transformer remains energized 24/7 but rarely experiences heavy loading. Amorphous core designs often win TCO comparisons here despite potentially higher Pk values.
Moderate Load Factor Operations (0.40–0.70):
Commercial buildings and general manufacturing see meaningful contributions from both loss types. Balanced designs using optimized CRGO typically prove most economical.
| Application | Typical Load Factor | Loss Priority | Recommended Core |
|---|---|---|---|
| Data center | 0.75–0.90 | Pk first | High-grade CRGO |
| Continuous process | 0.65–0.80 | Pk first | High-grade CRGO |
| General manufacturing | 0.50–0.65 | Balanced | Optimized CRGO |
| Commercial building | 0.35–0.55 | P0 emphasis | Amorphous or premium CRGO |
| Residential distribution | 0.20–0.40 | P0 dominant | Amorphous alloy |
For oil-immersed transformers in continuous process applications, our field data shows payback periods under 4 years for premium low-Pk designs when load factors exceed 0.70.
[Expert Insight: Load Profile Analysis in Practice]
- Actual load factors often differ significantly from design assumptions—request 12 months of load data before specifying
- Variable loads require weighted average calculations using actual duration curves, not simple arithmetic means
- Time-of-use electricity rates can shift optimal loss balance if peak Pk coincides with expensive rate periods
- For dry-type transformers in enclosed installations, higher losses compound cooling costs—factor auxiliary power consumption into TCO
Applying the capitalization method to real quotes demonstrates how apparent savings evaporate under lifecycle analysis.
The Two Quotes:
| Parameter | Quote A (Standard) | Quote B (Low-Loss) |
|---|---|---|
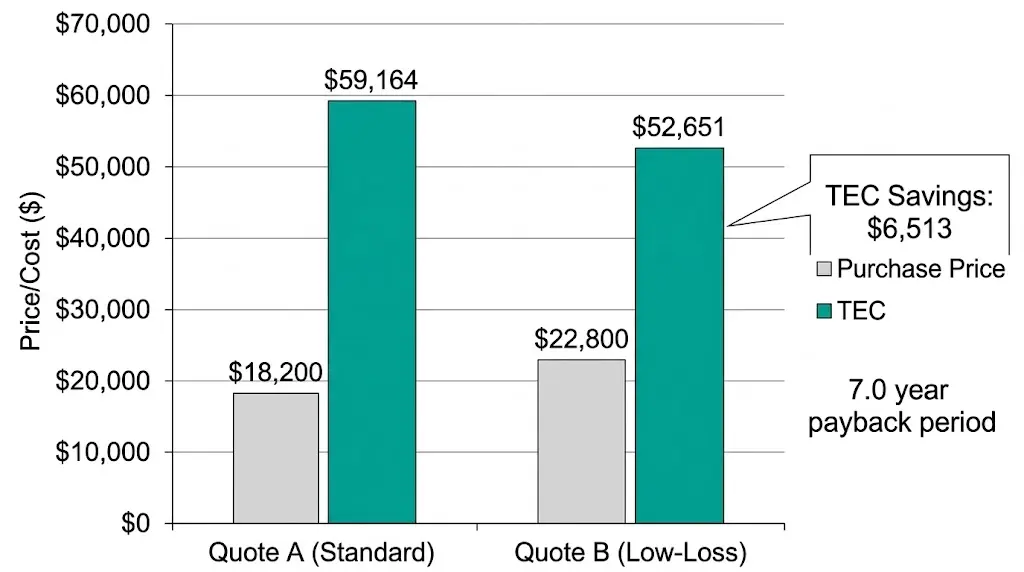
| Purchase Price | $18,200 | $22,800 |
| P0 (W) | 1,650 | 1,020 |
| Pk (W) | 12,200 | 9,600 |
Calculation Assumptions:
TEC Calculation:
Quote B saves $6,513 in TEC despite costing $4,600 more upfront.
Payback Calculation:
The remaining 13 years generate pure savings accumulation.
“Guaranteed maximum P0” and “Guaranteed maximum Pk” must appear explicitly in quotations. Typical or estimated values provide no contractual protection. According to IEC 60076-1, manufacturers must declare guaranteed values with measurement tolerances of +15% for individual losses when tested.
Pk varies with winding temperature. Oil-immersed units use 75°C reference; dry-type units use 120°C or 155°C depending on insulation class. Comparing losses measured at different reference temperatures invalidates the analysis entirely.
If the transformer includes on-load or de-energized tap changers, Pk varies by tap position—typically 5–15% variation across the tap range. Specify which tap position applies to guaranteed values.
Run Sensitivity Analysis
Before final commitment:
XBRELE supplies oil-immersed, dry-type, and amorphous alloy transformers across standard MV ratings, with every quotation including guaranteed P0 and Pk values per IEC 60076-1 test protocols. Factory test reports accompany delivery for loss verification.
Our technical team supports TCO analysis using your specific electricity rates and load factors, specification development for efficiency-focused procurement, and comparative analysis across multiple design options.
Contact our distribution transformer specialists for quotations with complete loss documentation.
Q: What is the difference between P0 and Pk transformer losses?
A: P0 (no-load loss) dissipates in the magnetic core continuously whenever energized, typically 0.1–0.5% of rated power. Pk (load loss) occurs in windings and scales with current squared, meaning 50% load produces only 25% of rated Pk.
Q: How do I calculate transformer total cost of ownership?
A: Apply the TEC formula: Purchase Price + (A × P0) + (B × Pk), where A and B are capitalized loss factors based on electricity rate, evaluation period, discount rate, and expected load factor.
Q: What load factor should I use for TCO analysis?
A: Use measured average load divided by transformer rating—actual values typically range from 0.25–0.40 for residential distribution, 0.35–0.55 for commercial buildings, and 0.65–0.85 for continuous industrial processes.
Q: When does an amorphous core transformer justify its premium?
A: Amorphous designs typically win TCO comparisons at load factors below 0.45, where their 60–70% P0 reduction outweighs any Pk penalty—common in rural distribution, standby service, and lightly loaded commercial feeders.
Q: How long does a high-efficiency transformer take to pay back its premium?
A: Payback periods typically range from 4–8 years depending on the efficiency gap and electricity cost, with high load factor operations achieving faster returns due to compounded Pk savings.
Q: Should transformer losses be compared at the same reference temperature?
A: Yes—Pk must be compared at identical reference temperatures (75°C for oil-immersed, 120°C or 155°C for dry-type), as winding resistance increases approximately 0.4% per degree Celsius.
Q: What loss measurement tolerances should I expect from manufacturers?
A: Industry standard per IEC 60076-1 permits +15% on individual P0 or Pk values and +10% on total losses; tighter tolerances can be specified contractually but may affect pricing.
Authority reference: For standard definitions and test context, see IEC 60076 publication page.