Need Full Specifications?
Download our 2025 Product Catalog for detailed drawings and technical parameters of all switchgear components.
Get CatalogDownload our 2025 Product Catalog for detailed drawings and technical parameters of all switchgear components.
Get CatalogDownload our 2025 Product Catalog for detailed drawings and technical parameters of all switchgear components.
Get Catalog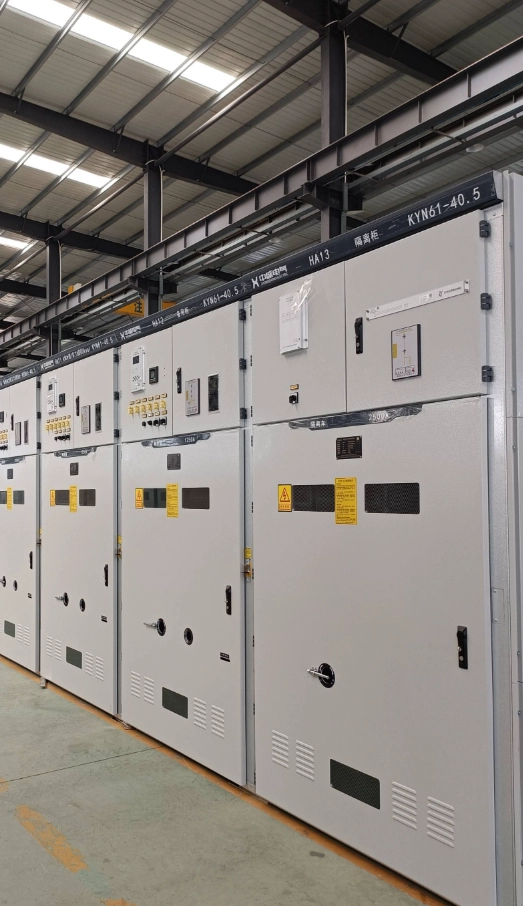
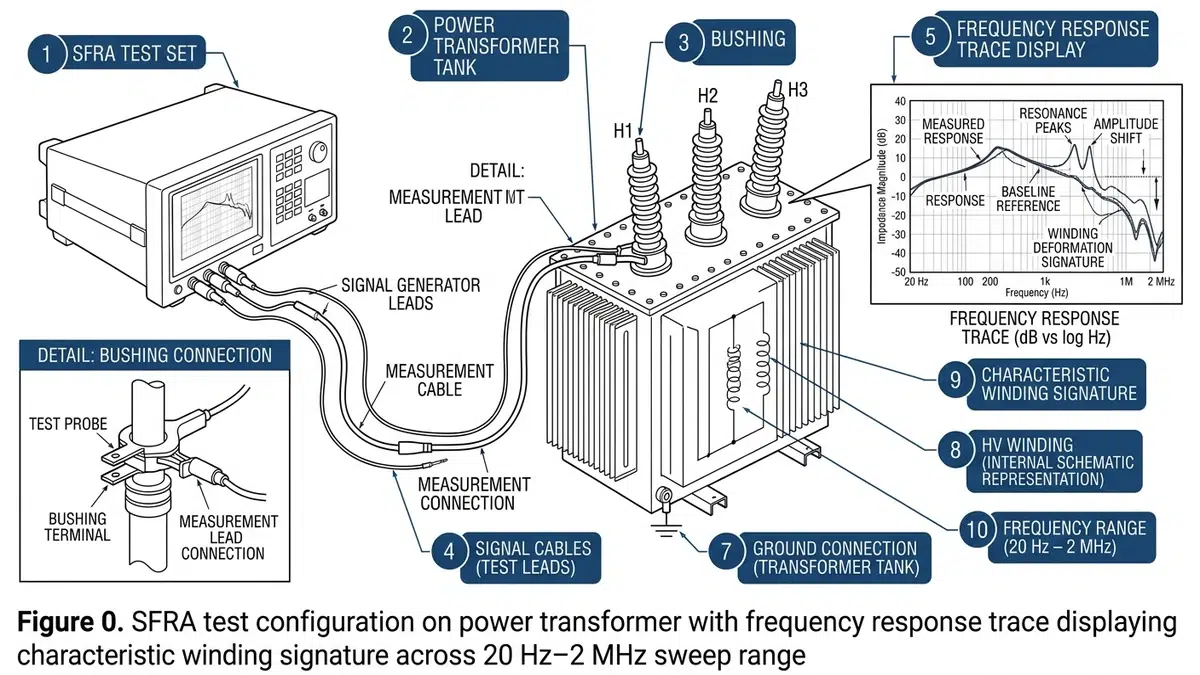
Sweep Frequency Response Analysis detects mechanical deformation inside power transformers by measuring how windings respond across thousands of frequencies. When winding geometry shifts—from short-circuit forces, transportation damage, or progressive aging—the frequency response signature changes measurably. This diagnostic technique identifies faults that conventional electrical tests miss: axial displacement, radial buckling, core movement, and connection degradation.
SFRA treats transformer windings as complex RLC networks. Each turn contributes distributed inductance. Each insulation layer adds capacitance. The core, clamping structures, and lead arrangements all influence how signals propagate through this electrical network.
During testing, instruments inject a low-voltage sinusoidal signal (typically 1–10 V) and sweep from 20 Hz to 2 MHz. At each frequency point, the system measures the output-to-input voltage ratio in decibels, creating a unique “fingerprint” trace. Modern instruments achieve resolution of 10 points per decade or finer, with typical amplitude ranges from 0 dB to -80 dB depending on winding configuration.
The physics divides into distinct diagnostic regions:
According to IEC 60076-18 (Power transformers—Measurement of frequency response), test voltage levels should remain below 10 V RMS to avoid influencing the transformer’s magnetic state. Changes in mechanical geometry as small as 1–2 mm in winding position can produce measurable frequency shifts.
Field experience across 200+ transformer diagnostics reveals clear patterns for when SFRA delivers maximum value. The technique excels after events that generate mechanical stress—but baseline measurements must exist first.
| Scenario | Timing | Purpose |
|---|---|---|
| Factory acceptance | Before shipment | Establish manufacturer baseline |
| Post-transportation | Before oil filling | Detect transit damage |
| Commissioning | Before energization | Confirm installation integrity |
| Post-fault event | Within 48 hours | Assess through-fault damage |
| Periodic assessment | Every 3–5 years | Trend mechanical condition |
Through-fault currents generate electromagnetic forces proportional to current squared. An 8 kA fault produces four times the mechanical stress of a 4 kA fault. IEEE C57.149 recommends SFRA assessment after any through-fault event exceeding 70% of rated short-circuit withstand current.
Other triggers warranting immediate testing include Buchholz relay operation, sudden pressure relay activation, unexplained DGA gas increases (particularly acetylene), audible winding noise changes, and seismic events at the installation site.
For power distribution transformers entering critical service, baseline SFRA at commissioning provides the reference needed for all future comparisons. Without this baseline, interpretation relies on phase-to-phase comparison—a less sensitive approach.
[Expert Insight: Field Deployment Considerations]
– Temperature affects low-frequency response; test at similar ambient conditions as baseline when possible
– Residual magnetization from recent DC resistance tests can shift low-frequency traces—demagnetize before SFRA if practical
– Document tap changer position exactly; different positions produce different valid signatures
– Mining and industrial substations with frequent motor starting experience cumulative through-fault stress—annual SFRA trending proves valuable
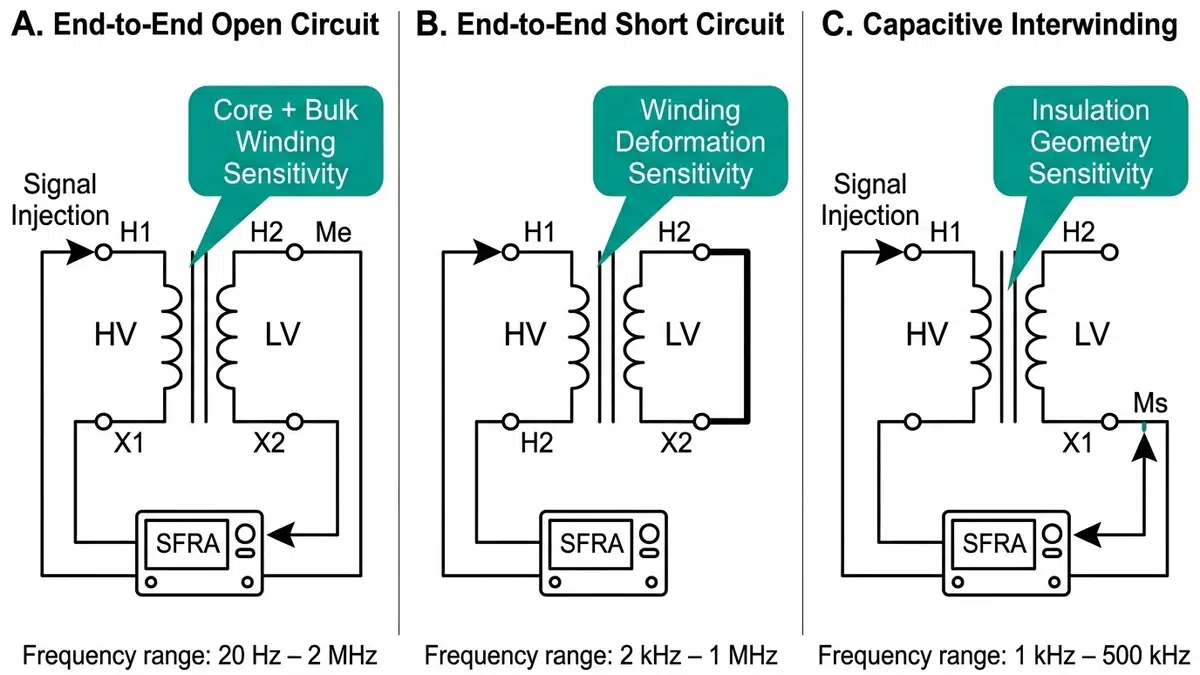
Three primary measurement configurations provide comprehensive transformer assessment. Each emphasizes different frequency regions and fault sensitivities.
\n
Signal injected at one terminal, measured at opposite terminal of same winding, all other terminals floating. This configuration captures the full winding response and reveals bulk geometry changes. Most sensitive to core-related issues at low frequencies.
\n
Same injection and measurement points, but with secondary windings shorted. The short circuit eliminates core inductance influence, increasing sensitivity to winding series inductance changes. Particularly effective for detecting axial winding displacement.
\n
Signal injected on HV winding, measured on LV winding with all terminals floating. This configuration emphasizes inter-winding capacitance and detects changes in the insulation geometry between windings.
| Configuration | Primary Sensitivity | Frequency Region |
|---|---|---|
| End-to-end open | Core defects, bulk movement | 20 Hz – 20 kHz |
| End-to-end short | Winding deformation | 2 kHz – 200 kHz |
| Capacitive interwinding | Insulation geometry | 10 kHz – 1 MHz |
Connection quality dominates high-frequency accuracy. Use dedicated SFRA test leads—standard multimeter leads introduce unacceptable impedance at frequencies above 100 kHz. Clean bushing terminals thoroughly before connecting. Maintain consistent lead routing between tests; lead movement shifts high-frequency response.
Ground configuration matters. Connect the instrument ground to the transformer tank at a single point. Avoid ground loops through multiple connections.
Successful SFRA interpretation requires systematic analysis across frequency bands, correlating deviations with probable physical causes. Raw traces mean nothing without comparison—either against historical baselines, phase-to-phase references, or sister unit data.
\n
Core magnetizing inductance dominates. Look for:
– First resonance frequency shift indicating core clamping issues
– Magnitude changes suggesting shorted core laminations
– Response shape differences from residual magnetization
\n
Main winding inductance and inter-winding capacitance interact. This region reveals:
– Bulk winding displacement (axial or radial)
– Inter-winding short circuits
– Major lead connection changes
\n
Localized winding geometry effects appear here. Detection includes:
– Turn-to-turn faults
– Localized winding deformation
– Tap winding problems
Time-based comparison offers highest sensitivity. Comparing current traces against historical baselines from the same unit detects changes as small as 1–2% winding displacement. This requires reliable historical data.
Phase-to-phase comparison works when baselines don’t exist. On three-phase transformers, comparing A-phase to B-phase to C-phase reveals asymmetric damage. Outer phases may show slight systematic differences from center phase on five-limb core designs—this is normal.
Sister unit comparison provides reference when neither baseline nor phase symmetry applies. Manufacturing tolerances mean sister units may differ by 2–3 dB at certain frequencies even when both are healthy.
Integration with vacuum circuit breaker protection systems matters for post-fault assessment. Breaker operation records document fault current magnitude and clearing time—data essential for evaluating whether observed SFRA deviations correlate with mechanical stress levels.
Interpreting SFRA results demands balancing statistical metrics with engineering judgment. No single threshold guarantees correct decisions—context determines appropriate action.
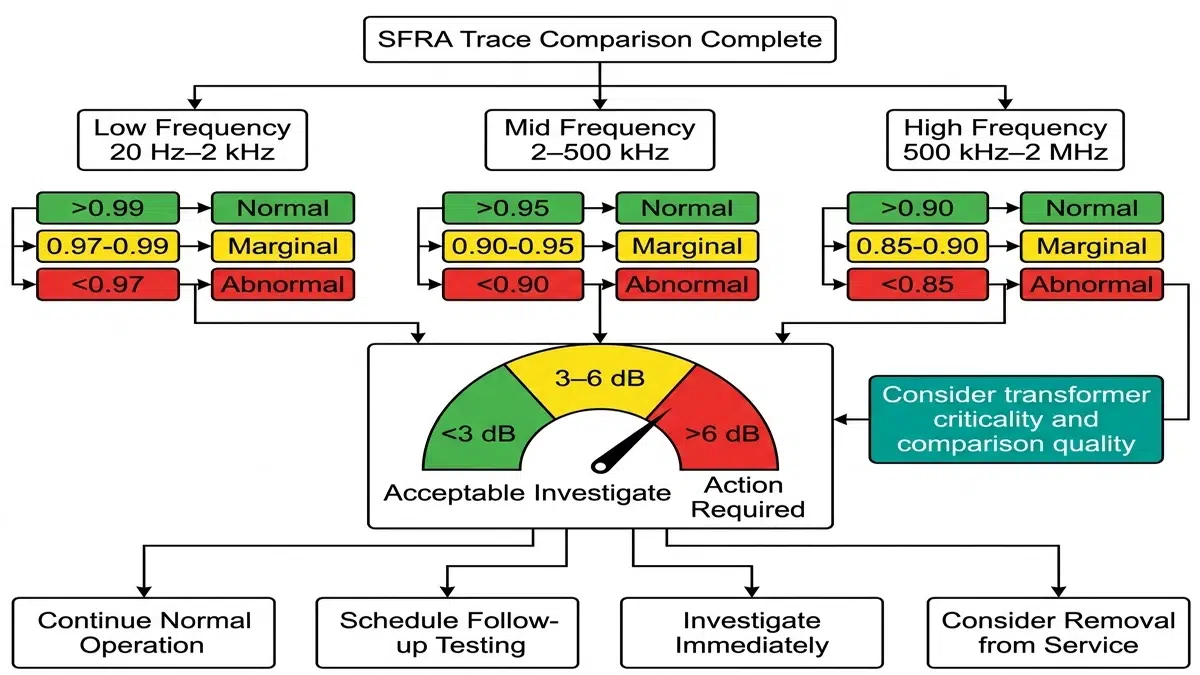
IEC 60076-18 recommends correlation coefficient calculation between reference and measured traces. Field experience suggests these practical thresholds:
| Frequency Region | Acceptable | Investigate | Reject |
|---|---|---|---|
| 20 Hz – 2 kHz | CC > 0.99 | 0.97–0.99 | < 0.97 |
| 2 kHz – 500 kHz | CC > 0.95 | 0.90–0.95 | < 0.90 |
| 500 kHz – 2 MHz | CC > 0.90 | 0.85–0.90 | < 0.85 |
[VERIFY STANDARD: Specific correlation coefficient thresholds vary between IEC 60076-18 and IEEE C57.149; verify applicable standard for contractual acceptance testing]
The absolute deviation method measures decibel differences at corresponding frequency points:
– Below 3 dB: Generally within measurement repeatability
– 3–6 dB: Investigate further; may indicate developing issues
– Above 6 dB: Strongly suggests mechanical displacement requiring intervention
Transformer criticality influences acceptable risk. A 5 dB deviation on a 100 MVA transmission autotransformer justifies immediate investigation. Similar deviation on a 2 MVA distribution unit may permit continued monitoring with shortened assessment intervals.
Comparison quality affects threshold stringency. Time-based comparison against reliable factory baseline permits tighter limits than phase-to-phase comparison on units with unknown history.
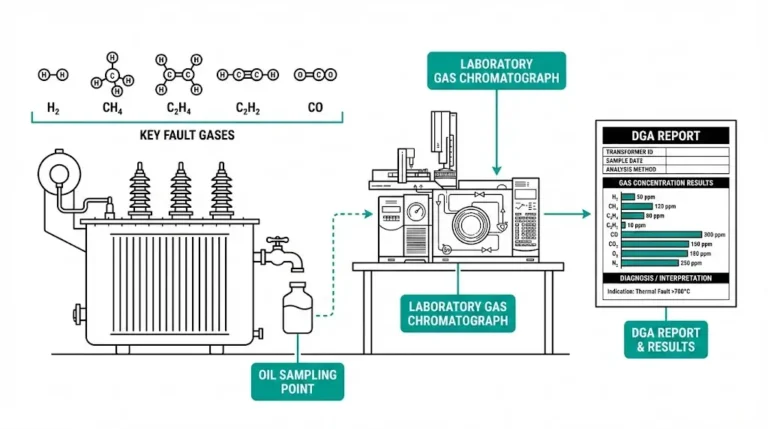
For oil-immersed transformers showing borderline SFRA results, correlate findings with dissolved gas analysis. Mechanical faults often generate characteristic gases—acetylene from arcing, ethylene from hot spots. Consistent findings across multiple diagnostic methods strengthen confidence in conclusions.
[Expert Insight: Acceptance Decision Realities]
– Correlation coefficients screen for problems but don’t diagnose them—low CC identifies “something changed,” not “what changed”
– High-frequency deviations (>500 kHz) often reflect connection differences rather than winding problems; verify lead routing before concluding fault
– Phase-to-phase comparison on delta windings requires careful terminal identification; misidentified phases produce false alarms
– When historical and sister unit comparisons disagree, weight historical data higher—it reflects this specific unit’s characteristics
SFRA excels at detecting mechanical changes but provides incomplete pictures alone. Comprehensive transformer assessment combines multiple techniques, each revealing different failure modes.
\n
Mechanical faults generate gases. Acetylene indicates arcing. Ethylene suggests localized overheating. When SFRA shows winding displacement and DGA shows rising acetylene, confidence in mechanical damage increases substantially.
\n
Shorted turns detected by SFRA should produce corresponding resistance anomalies. If SFRA indicates turn-to-turn faults but winding resistance remains normal, investigate measurement quality before concluding transformer health.
\n
Winding movement changes leakage reactance. Trend short-circuit impedance alongside SFRA—both should show correlated changes for genuine mechanical displacement.
\n
Insulation condition affects capacitive response. Significant power factor changes may correlate with SFRA high-frequency deviations if insulation degradation alters geometry.
For dry-type transformers, visual inspection complements SFRA effectively. Without oil obscuring the active part, winding deformation may be directly visible through ventilation openings—confirmation impossible on oil-filled units.
SFRA interpretation benefits from manufacturer-specific knowledge. Design details—winding geometry, insulation systems, clamping arrangements—influence expected frequency response characteristics and acceptable deviation ranges.
XBRELE’s transformer engineering team provides:
For diagnostic consultation on distribution transformer SFRA interpretation, contact XBRELE’s technical support team. Access to original design documentation enables confident assessment of whether observed deviations indicate actionable problems or acceptable manufacturing variation.
\n
Complete SFRA assessment including all three configurations requires 2–4 hours for a three-phase distribution transformer, with additional time needed for connection setup, documentation, and preliminary on-site analysis.
\n
SFRA does not detect partial discharge directly; it measures mechanical geometry through frequency response signatures. Partial discharge assessment requires dedicated PD measurement equipment operating on different principles.
\n
Resonance frequency shifts result from changes in effective inductance or capacitance—winding displacement alters both parameters. Upward frequency shifts typically indicate reduced inductance (compressed windings), while downward shifts suggest increased inductance (separated windings or loosened clamping).
\n
SFRA requires the transformer to be de-energized and isolated. The test injects signals into windings that would be overwhelmed by power frequency voltages, and personnel safety requires lockout-tagout procedures before connection.
\n
Temperature primarily influences low-frequency response through core permeability and oil viscosity effects. For reliable comparison, test at ambient conditions within ±10°C of baseline measurements, or apply temperature correction factors if wider variations exist.
\n
Yes, post-transportation SFRA comparison against factory baseline effectively reveals shipping damage. Best practice calls for SFRA at the factory before shipment and again at site before oil filling—comparing these traces identifies transit-induced mechanical displacement.
\n
Competent SFRA testing requires understanding of transformer construction, measurement equipment operation, and connection protocols. Interpretation demands deeper expertise—most utilities either develop specialist teams or engage manufacturer support for result analysis.
Technical content reflects field diagnostic practices for medium-voltage and high-voltage power transformers. Specific acceptance thresholds should align with asset owner policies, applicable standards, and transformer criticality assessments.