Need Full Specifications?
Download our 2025 Product Catalog for detailed drawings and technical parameters of all switchgear components.
Get CatalogDownload our 2025 Product Catalog for detailed drawings and technical parameters of all switchgear components.
Get CatalogDownload our 2025 Product Catalog for detailed drawings and technical parameters of all switchgear components.
Get Catalog
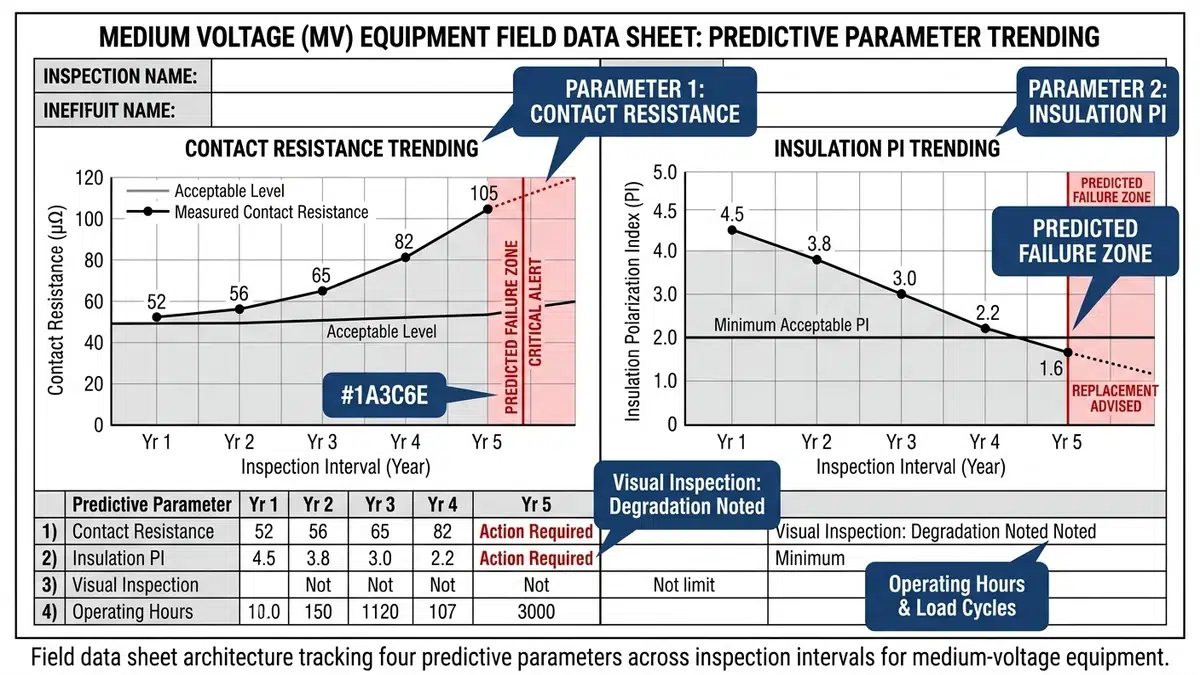
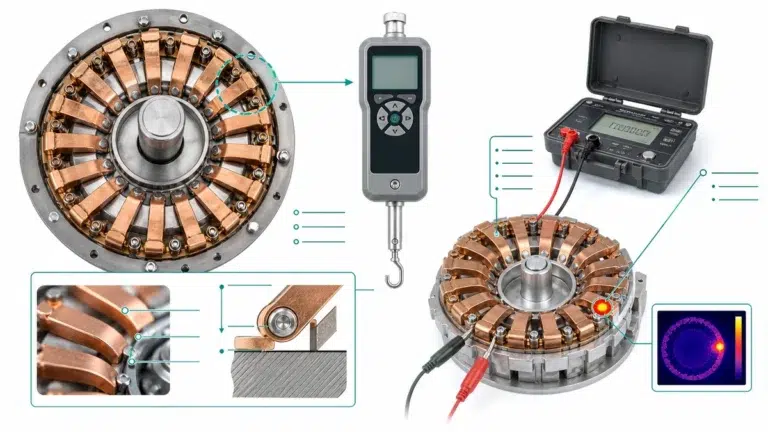
Build MV equipment field data sheets that track contact resistance, insulation, timing, and trends before failures occur.
Every switchgear cabinet, every circuit breaker, every protective relay tells a story through the data it generates. Yet in my 18 years of maintaining medium-voltage electrical equipment across industrial facilities and utility substations, I’ve watched countless maintenance teams collect thousands of data points that ultimately predict nothing. The field data sheets become filing cabinet fodder—boxes of historical records that reveal their value only after a catastrophic failure forces forensic analysis.
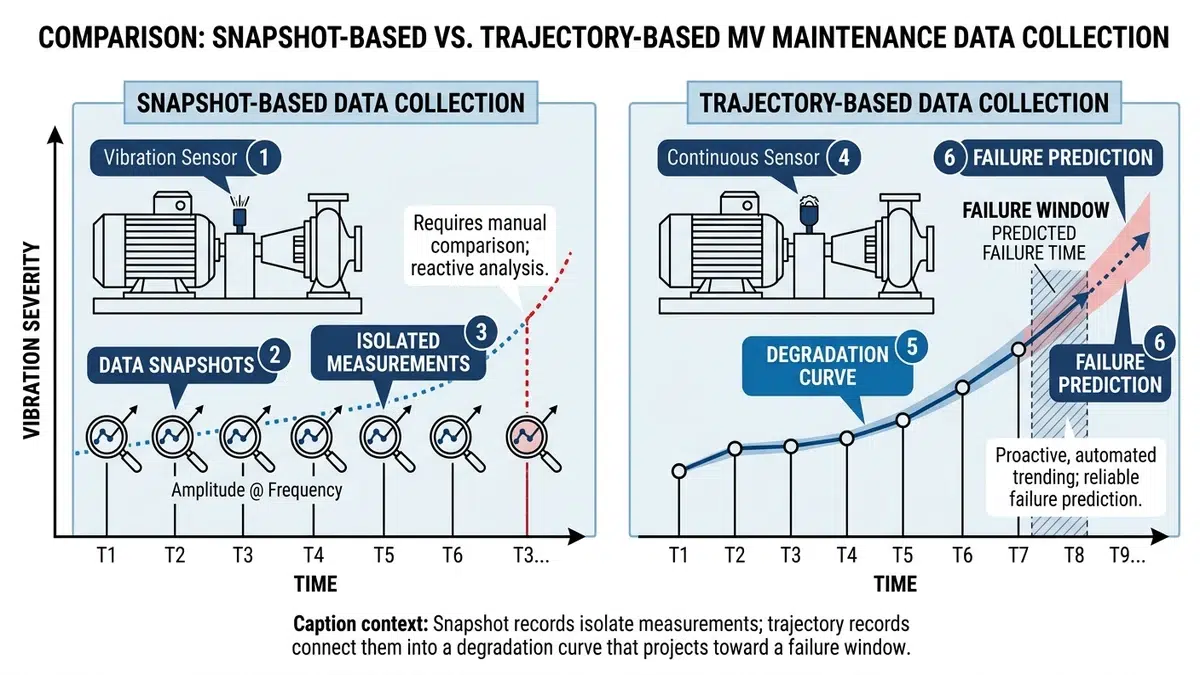
The fundamental problem isn’t data collection; it’s data architecture. Most field data sheets capture what happened rather than what’s happening. They record snapshots when they should be tracking trajectories. A contact resistance reading of 150 microohms means nothing in isolation. But that same reading, when charted against the 85 microohms measured three years ago and the 120 microohms recorded 18 months back, reveals a degradation curve that points toward failure with mathematical precision.
This article presents a systematic approach to designing field data sheets that transform routine inspections into predictive intelligence. Drawing from reliability engineering principles and hard-won field experience, we’ll examine how to structure data collection so that your records become genuine failure predictors rather than compliance artifacts.
Before designing a predictive data sheet, you must understand how MV equipment fails. Failures rarely arrive without warning—they announce themselves through measurable parameter changes that accelerate as degradation progresses.
Medium-voltage equipment operates in a constant battle against entropy. Contact surfaces oxidize and pit. Insulation systems absorb moisture and develop tracking paths. Mechanical linkages wear and develop slack. Each degradation mechanism produces characteristic signatures:
Thermal Degradation follows an Arrhenius relationship—reaction rates double approximately every 10°C above rated temperature. A vacuum circuit breaker operating consistently at 75°C will experience insulation aging roughly four times faster than one operating at 55°C. Your data sheet must capture not just spot temperatures but operational temperature history.
Contact Degradation manifests through resistance trending. Fresh silver-plated contacts might measure 25 microohms. That reading will increase predictably with each switching operation and environmental exposure. The critical insight: it’s not the absolute value that predicts failure but the rate of change and any sudden discontinuities in the trend.
Insulation Degradation reveals itself through multiple parameters—decreasing insulation resistance, increasing dissipation factor, and changing capacitance values. The relationship between these parameters often provides more diagnostic information than any single measurement.
For predictive purposes, MV equipment failures divide into three categories:
A properly designed data sheet captures information relevant to all three categories while emphasizing parameters that enable early detection of the first two.
Traditional field data sheets suffer from a fundamental design flaw: they’re organized around inspection convenience rather than analytical utility. Technicians fill boxes, supervisors file papers, and the predictive potential remains locked away.
The first architectural principle is designing for trend analysis from the outset. Every quantitative measurement needs:
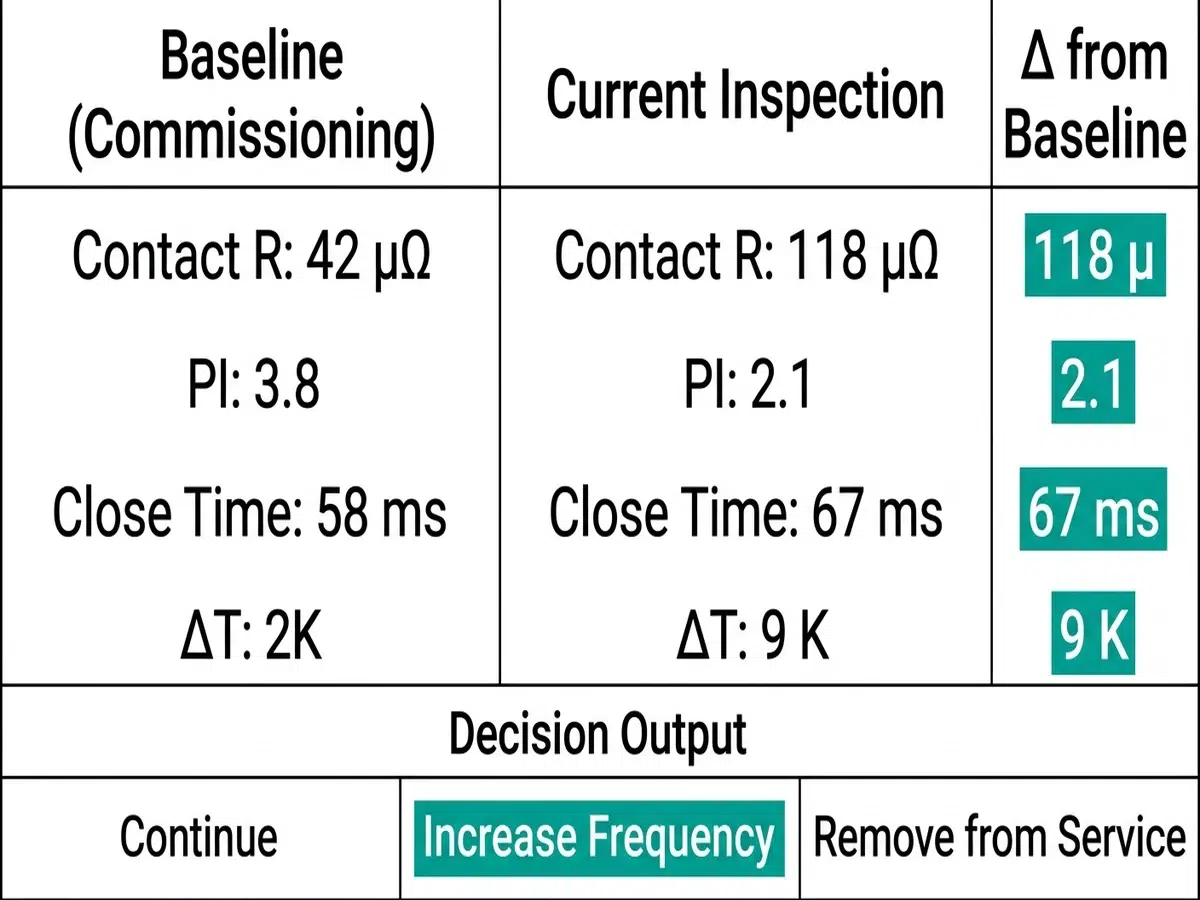
When a technician performing contact resistance testing sees not just today’s reading but the trajectory from previous inspections, pattern recognition becomes intuitive. A reading of 200 microohms that appears acceptable in isolation becomes obviously concerning when displayed alongside baseline of 50 microohms and a trend showing 30% increase per year.
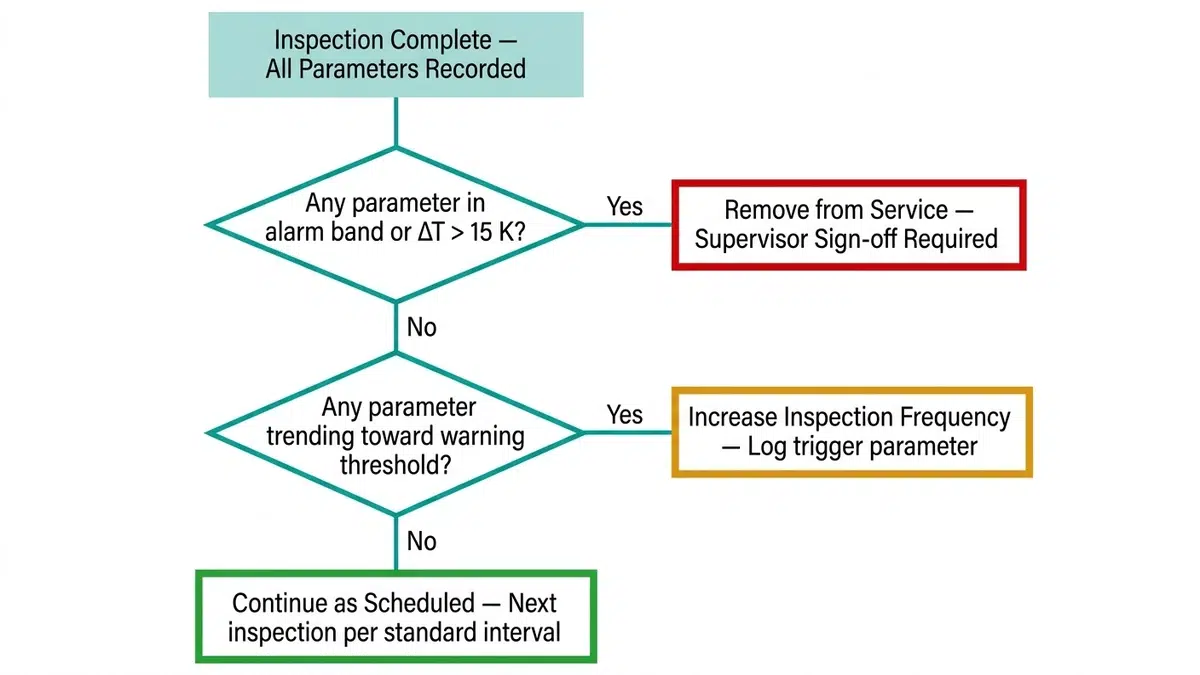
Effective predictive data sheets incorporate decision trees that guide additional investigation based on findings. For example:
If contact resistance exceeds baseline by >100%:
– Perform detailed thermal imaging under load
– Document contact surface condition photographically
– Measure contact force with calibrated gauge
– Record to enhanced monitoring schedule
This conditional logic transforms passive recording into active investigation, ensuring that early warning signs trigger appropriate follow-up rather than disappearing into records that no one reviews until failure occurs.
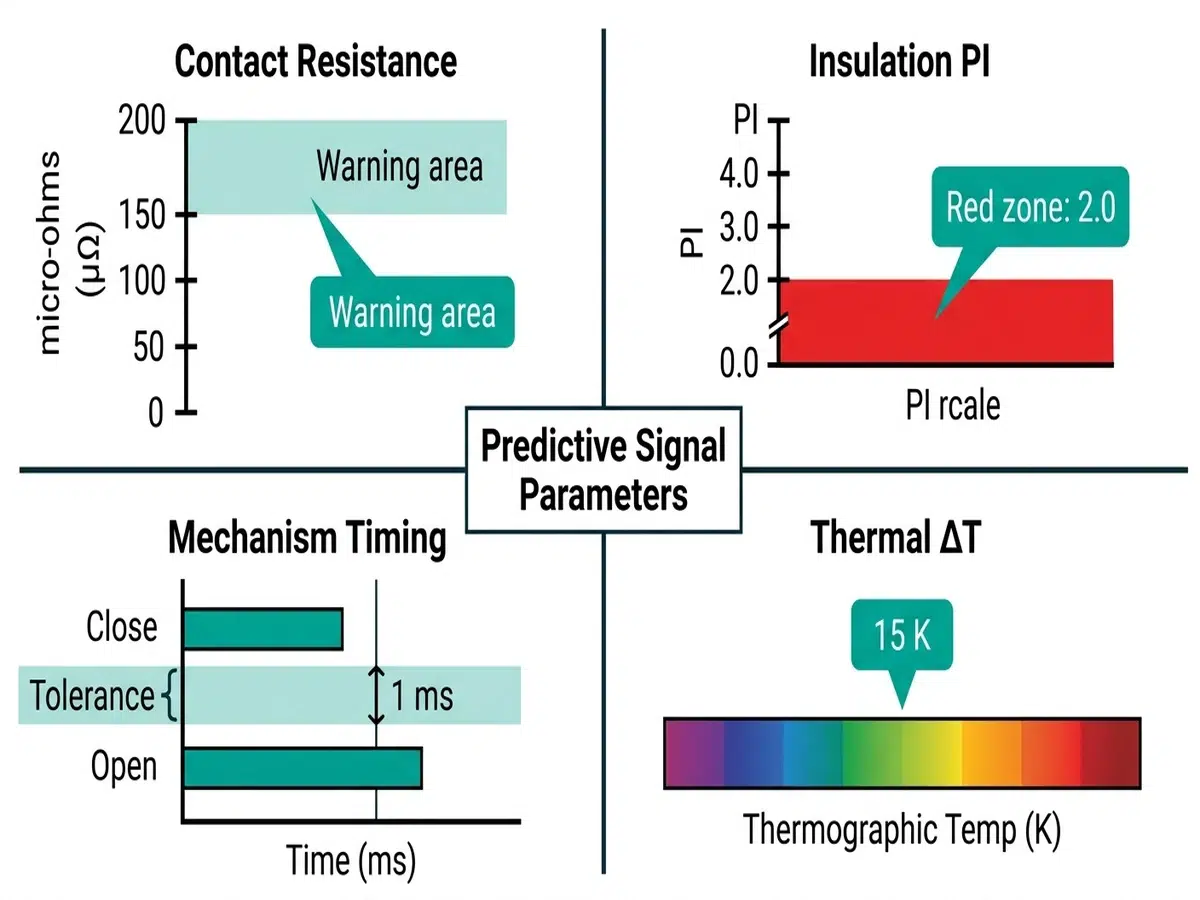
Not all measurements contribute equally to failure prediction. After analyzing failure records from over 400 MV equipment failures, I’ve identified the parameters that most reliably provide early warning across equipment categories.
Contact Resistance Trending remains the single most valuable predictor for switchgear and circuit breakers. The key is consistency—same test current, same connection points, same ambient temperature correction. A 50% increase from baseline warrants investigation; doubling indicates imminent action required.
Insulation Resistance with Polarization Index provides degradation intelligence for cable systems, bushings, and rotating equipment. Single megohm readings mean little; the ratio of 10-minute to 1-minute readings (Polarization Index) reveals contamination and moisture absorption that spot readings miss.
Dissolved Gas Analysis Trending for oil-filled equipment detects thermal and electrical faults while still in nascent stages. Key gases include:
| Gas | Primary Indication | Warning Trend |
|---|---|---|
| Hydrogen | Corona, partial discharge | >100 ppm or doubling rate |
| Acetylene | Arcing | Any detectable level |
| Ethylene | Severe overheating | >100 ppm |
| Methane | Low-temp thermal fault | Ratio changes |
Mechanical Timing Analysis for circuit breakers captures wear in operating mechanisms before it affects protective function. Close time, open time, and contact bounce duration all degrade predictably with operation count.
Beyond primary predictors, capture environmental and operational factors that correlate with accelerated degradation:
These correlation parameters enable multivariate analysis that dramatically improves prediction accuracy.
With parameters identified and architecture established, practical sheet design determines whether technicians will actually collect quality data.
Workflow alignment places data fields in the sequence technicians naturally follow during inspection. Fighting the physical inspection flow introduces errors and omissions.
Visual hierarchy emphasizes critical predictive parameters while maintaining space for supporting data. Use bold borders, color coding (if printing permits), and strategic white space.
Error reduction features include:
– Explicit units on every measurement field
– Acceptable range indicators adjacent to entry fields
– Check boxes for qualitative observations to prevent ambiguity
– Required fields clearly marked
Trend visualization zones reserve space for mini-graphs showing historical readings. Even simple hand-drawn trend lines dramatically improve pattern recognition.
Modern data collection increasingly uses tablets and specialized software, but the architectural principles remain identical. Digital platforms offer advantages:
However, digital systems must maintain offline capability for locations with poor connectivity and should generate printed summaries for field reference during equipment access.
Predictive power depends entirely on quality baselines. The most elegant data architecture becomes worthless without accurate reference points.
Optimal baseline establishment occurs:
Baseline measurements require standardized conditions documented on the data sheet:
– Ambient temperature (with correction factors for comparison)
– Time since last operation (for breakers)
– Load condition at time of measurement
– Measurement equipment identification and calibration date
Not every baseline reading deserves trust. Quality validation includes:
Document baseline confidence level explicitly. A baseline established under ideal conditions with calibrated equipment deserves more analytical weight than one captured opportunistically during an outage.
Data collection without analysis methodology produces records, not predictions. Your data sheet system must include explicit frameworks for translating measurements into maintenance decisions.
For parameters with sufficient history (minimum five data points), apply basic statistical methods:
Linear regression projects future values based on historical trend. When projected values cross warning thresholds within the next inspection interval, schedule preventive action.
Rate of change monitoring detects acceleration in degradation. Constant degradation rates suggest normal wear; accelerating rates often indicate emerging failure mechanisms.
Deviation analysis compares individual equipment against fleet populations. An outlier performing significantly worse than peers warrants investigation even if absolute values remain acceptable.
Single parameters rarely tell complete stories. Develop correlation frameworks that examine relationships:
Contact resistance + temperature rise: Both should trend together. Contact resistance increasing without corresponding temperature rise during load surveys suggests measurement inconsistency. Temperature rise without resistance increase may indicate issues in components other than main contacts.
Insulation resistance + power factor + capacitance: Cross-correlating these bushing or cable parameters improves diagnostic specificity. Moisture contamination affects all three in characteristic patterns; thermal damage shows different signatures.
Explicit action thresholds eliminate ambiguity and ensure consistent response:
| Condition | Required Action | Timeframe |
|---|---|---|
| Within normal band | Continue routine monitoring | Per schedule |
| Warning threshold exceeded | Enhanced monitoring, plan intervention | Next available outage |
| Alarm threshold exceeded | Mandatory intervention | Within 30 days |
| Critical threshold exceeded | Immediate de-energization consideration | Emergency response |
Document these thresholds directly on data sheets so field technicians can immediately recognize conditions requiring escalation.
Launching a predictive data sheet system requires more than distributing new forms. Successful implementation demands organizational commitment and systematic refinement.
Technicians accustomed to checkbox inspections need training not just in new procedures but in analytical mindset. Effective programs include:
Track prediction accuracy systematically:
These outcomes inform continuous refinement of parameters, thresholds, and analysis frameworks. Early implementations typically show 60-70% prediction accuracy for wear-out failures; mature systems achieve 85%+ through iterative improvement.
Standalone data sheets provide value, but integration with computerized maintenance management systems (CMMS) and asset performance management (APM) platforms multiplies analytical capability. Ensure your data sheet design facilitates:
For additional technical standards on reliability data collection, the IEEE 493 (Gold Book) on industrial and commercial power systems reliability provides authoritative guidance on data requirements and analysis methods.
At a pharmaceutical manufacturing facility, routine data collection on 15kV vacuum circuit breakers captured contact resistance trending over a six-year period. Breaker 52-7 showed baseline resistance of 28 microohms at commissioning. Subsequent readings:
Linear projection indicated crossing of the 150-microohm intervention threshold within 18 months. More significantly, the rate of change had accelerated—a signature pattern for vacuum interrupter deterioration.
Scheduled replacement during the next planned outage revealed significant contact erosion from an undocumented fault interruption event. Post-failure analysis estimated remaining life at approximately 14 months—confirming the predictive analysis within reasonable accuracy.
A 4.16kV metal-clad switchgear lineup showed concerning insulation resistance readings during annual testing. Readings had dropped 40% from baseline, triggering warning thresholds.
However, the enhanced data sheet captured ambient conditions: testing occurred during a high-humidity period following equipment sitting de-energized for an extended outage. Power factor trending remained stable, and capacitance readings showed no significant change.
Multi-parameter analysis correctly attributed the IR decrease to surface moisture rather than insulation degradation. A brief re-energization period followed by retesting confirmed recovery to near-baseline values, avoiding unnecessary and expensive bushing replacement.
Meaningful trend analysis requires a minimum of five data points spanning at least three inspection intervals. However, confidence increases significantly with 8-10 points. For newly installed equipment, industry fleet data can supplement limited local history until sufficient equipment-specific data accumulates. The key is maintaining consistent measurement conditions across all data points to ensure comparability.
The optimal approach combines digital primary collection with paper backup capability. Digital systems provide superior trending, analysis, and integration features. However, many MV equipment locations present connectivity challenges, and some facilities restrict electronic devices in certain areas. Design your data sheet system to function in either medium, with clear protocols for transferring paper records into electronic systems when collected manually.
For legacy equipment, establish “current state” baselines through comprehensive characterization testing. Accept that these represent equipment in aged condition rather than true as-new baselines. Supplement with manufacturer specifications and fleet data from similar equipment to establish reasonable expectation ranges. Document clearly that baselines represent current condition rather than commissioning values, and adjust threshold calculations accordingly.
Effective data sheets concentrate detailed collection on the 15-20% of parameters with highest predictive value rather than attempting comprehensive measurement of all possible parameters. For most MV equipment, this means thorough focus on contact resistance, insulation characteristics, and mechanical timing, with streamlined capture of secondary parameters. A well-designed sheet capturing critical predictive parameters should add no more than 30-45 minutes to traditional inspection duration.
Threshold validation requires tracking outcomes over time. Excessive false positives (predicted failures that don’t materialize) suggest thresholds are too conservative. Missed failures (events without prior warning) indicate thresholds too lenient or parameters missing from collection. Plan annual threshold reviews using accumulated outcome data, and benchmark against industry practices and manufacturer recommendations. Expect 2-3 years of refinement before achieving optimal threshold calibration.
Predictive data collection complements but doesn’t replace all time-based maintenance. Some activities—lubrication, cleaning, mechanical adjustments—must occur on schedules regardless of measured condition. However, effective predictive programs can safely extend intervals for condition-dependent activities like contact replacement and insulation rehabilitation, often by 50-100% beyond traditional time-based schedules. The key is identifying which maintenance activities respond to condition monitoring versus which require time-based intervention.
Anomalous data demands investigation rather than dismissal. First, verify measurement accuracy through equipment calibration checks and remeasurement. Second, examine whether environmental or operational factors explain the anomaly. Third, check for data recording errors. If the anomaly persists after verification, treat it as important intelligence—genuine anomalies often provide the earliest failure warnings. Document investigative findings on the data sheet for future reference.
Building field data sheets that actually predict failures requires fundamental reconceptualization of why we collect data. The shift from compliance documentation to predictive intelligence touches every aspect of the data collection system—from parameter selection through analysis frameworks to organizational culture.
Design for trajectories, not snapshots: Every measurement gains predictive value when viewed as part of a trend rather than an isolated reading
Focus on the vital few: Concentrate collection effort on parameters with demonstrated predictive correlation—contact resistance, insulation characteristics, mechanical timing, and dissolved gas analysis provide the highest return on collection investment
Build analysis into the sheet: Integrate historical trending, conditional logic, and decision thresholds directly into field documents rather than leaving analysis for later
Establish and protect baseline quality: Predictive accuracy depends entirely on reference point validity; invest appropriately in baseline establishment and documentation
Close the feedback loop: Track predictive accuracy systematically and use outcomes to continuously refine parameters, thresholds, and analysis frameworks
Train for understanding: Technicians who understand the predictive purpose of data collection produce higher quality records than those simply following procedures
The investment in developing truly predictive data collection systems returns dividends in prevented failures, optimized maintenance intervals, and extended equipment life. More importantly, it transforms maintenance from reactive repair into proactive reliability management—shifting your organization from fighting failures to preventing them.
Related Articles:
– [Contact Resistance Testing: Best Practices for Medium-Voltage Switchgear]
– [Interpreting Dissolved Gas Analysis Results in Power Transformers]
– [Vacuum Circuit Breaker Maintenance: Timing Analysis and Condition Assessment]
– [Building an Effective Electrical Reliability Program]
– [Thermal Imaging for Medium-Voltage Equipment: Beyond Hot Spots]