Need Full Specifications?
Download our 2025 Product Catalog for detailed drawings and technical parameters of all switchgear components.
Get CatalogDownload our 2025 Product Catalog for detailed drawings and technical parameters of all switchgear components.
Get CatalogDownload our 2025 Product Catalog for detailed drawings and technical parameters of all switchgear components.
Get Catalog
Every vacuum circuit breaker closing operation triggers two unavoidable phenomena that directly impact contact life and switching reliability. In field assessments across more than 40 industrial substations, these timing anomalies account for approximately 35% of premature contact wear issues in medium-voltage applications.
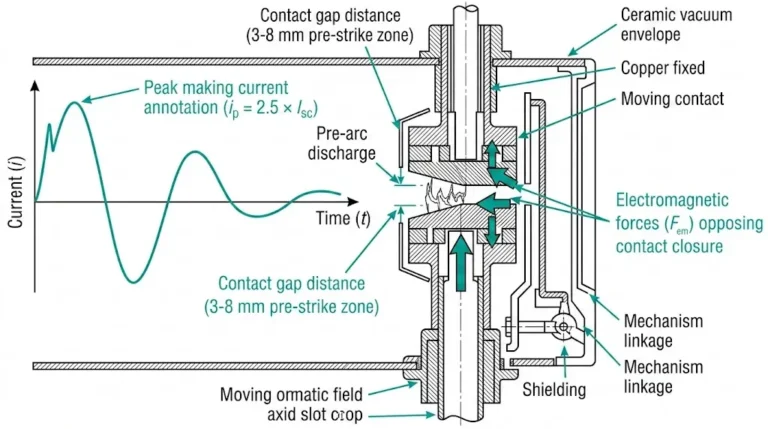
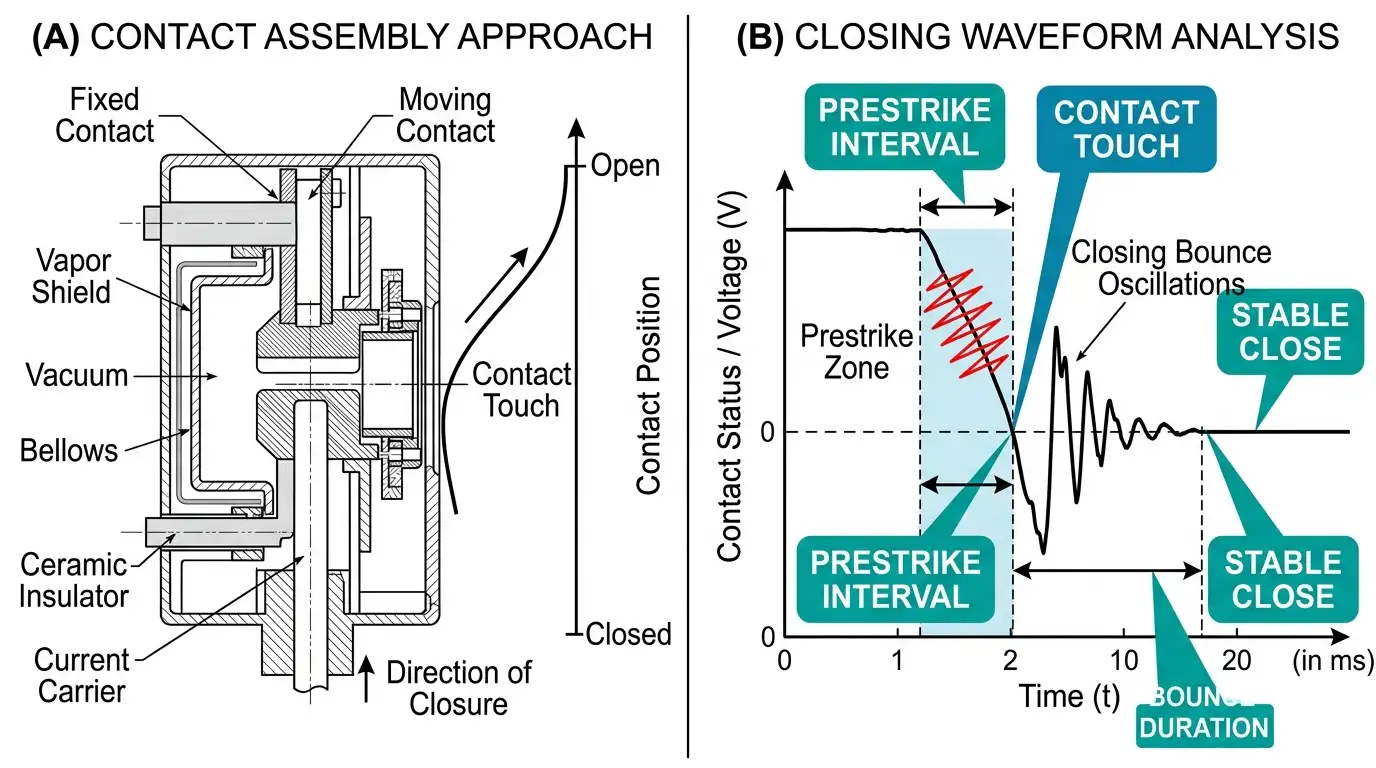
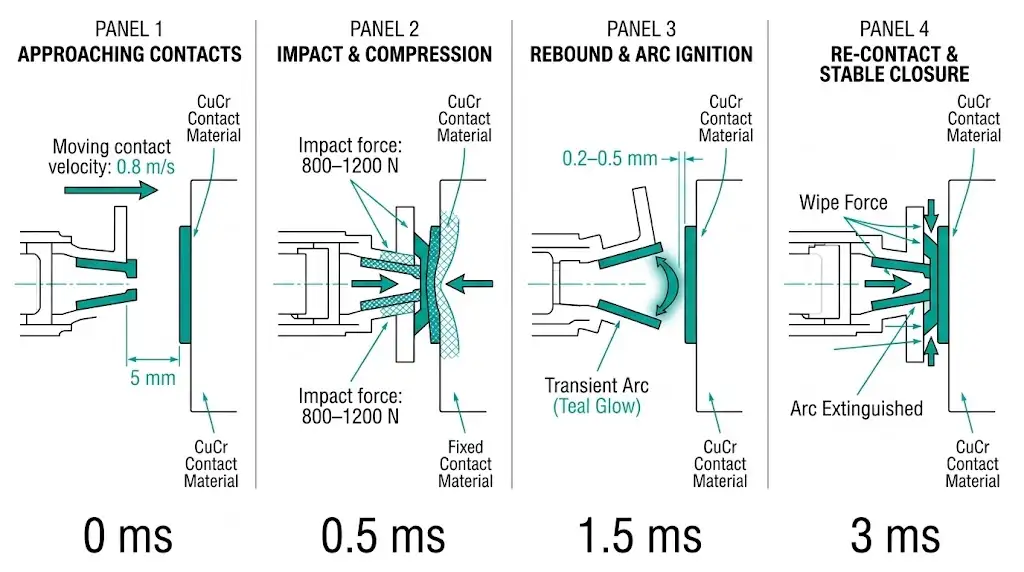
Prestrike occurs when the electric field intensity across the shrinking contact gap exceeds the dielectric withstand capability of the remaining vacuum space. As contacts approach within 2–4 mm during closing, an arc establishes before physical touch—conducting load current through ionized metal vapor rather than solid contact surfaces. This pre-arc causes localized heating and accelerated erosion at rates 3–5 times higher than normal switching wear.
Closing bounce follows immediately after contact touch. The moving contact assembly, traveling at 0.6–1.2 m/s for 12 kV vacuum circuit breakers, carries significant kinetic energy. Upon impact, elastic deformation stores this energy momentarily before releasing it as rebound motion. The contacts separate briefly, re-engage, and may repeat this cycle 2–5 times within 3–8 milliseconds. Each bounce generates a transient arc that erodes CuCr contact surfaces and deposits metallic particles within the vacuum interrupter chamber.
The severity relationship follows predictable patterns. Higher closing velocities reduce prestrike duration but increase bounce amplitude. Slower approaches minimize bounce but extend prestrike arcing time. Optimal mechanism tuning requires balancing these competing factors through systematic adjustment of operating parameters.
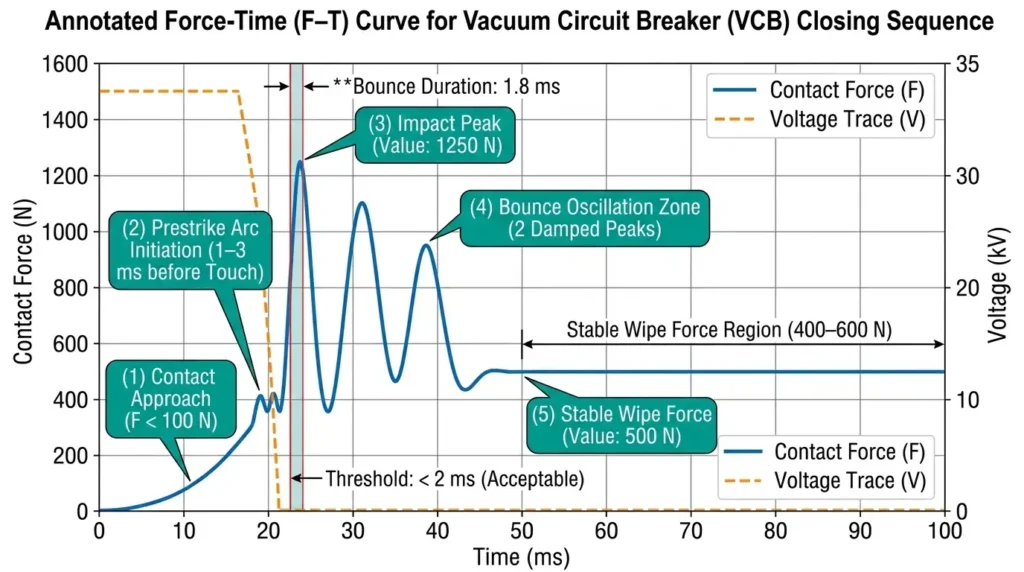
Force-time (F-T) curves represent the fundamental diagnostic method for identifying closing bounce and prestrike behavior. These timing curves plot contact force against elapsed time during closing operations, revealing mechanical irregularities invisible to standard electrical tests.
The physics is straightforward: when contacts approach within the critical gap distance—typically 2–8 mm in 12 kV vacuum circuit breakers—prestrike arc initiation occurs before mechanical touch. The F-T curve captures this sequence with microsecond resolution, exposing the precise relationship between electrical and mechanical events.
A healthy closing operation produces a characteristic profile. Gradual force increase occurs during approach, followed by a defined impact peak at contact touch ranging 800–1,500 N depending on manufacturer design. Stable wipe force then maintains contact pressure. Contact bounce appears as multiple oscillations in the 0.5–5 ms range after initial touch, while prestrike timing shows electrical conduction beginning 1–3 ms before the mechanical force signature indicates physical contact.
The measurement setup requires precise sensor placement. Force transducers rated for dynamic response (bandwidth ≥ 10 kHz) mount directly on the contact stem or operating rod. Synchronization with current injection allows correlation between electrical prestrike (Iarc onset) and mechanical events (Fcontact rise). According to IEC 62271-100, the total closing time tolerance should remain within ±10% of the manufacturer’s nominal value, typically 40–80 ms for spring-operated mechanisms.
Three critical parameters extracted from F-T curves guide maintenance decisions:
Field experience demonstrates that bounce duration exceeding 3 ms correlates strongly with accelerated contact erosion, reducing vacuum interrupter service life by 15–25% in switching-intensive applications such as capacitor bank switching and motor starting duties.
[Expert Insight: Timing Curve Measurement Best Practices]
- Position force transducers within 50 mm of contact interface for accurate dynamic response
- Capture minimum 10 consecutive closing operations to identify intermittent anomalies
- Record ambient temperature with each test session — mechanism behavior shifts measurably between –25°C and +40°C
- Store baseline curves at commissioning for future comparison against degraded performance
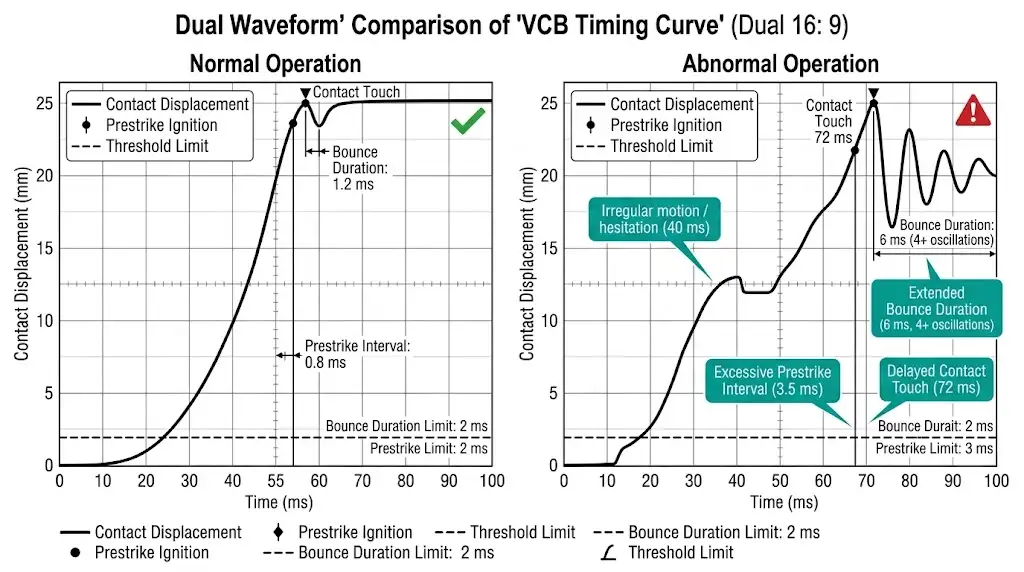
Timing curves provide the diagnostic foundation for identifying mechanism faults before catastrophic failure. These graphical representations plot contact position against time during switching operations, revealing mechanical behavior that remains invisible during routine inspections.
A properly functioning vacuum interrupter produces a timing curve with smooth acceleration through the closing stroke, achieving contact touch within manufacturer specifications—typically 45–80 ms for spring-operated mechanisms. The curve should show minimal oscillation at the contact touch point, with bounce duration not exceeding 2 ms according to VCB rated parameters and operating tolerances.
Closing bounce manifests as damped oscillations immediately following initial contact touch. The diagnostic indicators include:
Temperature variations between –25°C and +40°C can shift bounce characteristics by 15–20%, requiring temperature-compensated analysis for accurate trending.
Prestrike appears on timing curves as electrical conduction occurring before mechanical contact touch. Current sensors integrated with position transducers reveal a gap—typically 1–3 mm—between electrical closure and physical closure points.
When prestrike intervals extend beyond 2 ms consistently, investigation should focus on closing velocity (too slow), contact gap condition (erosion affecting field distribution), or vacuum degradation (reduced dielectric strength). According to IEEE C37.09, timing curve analysis should incorporate minimum and maximum operating voltages to capture voltage-dependent prestrike behavior across the full operating range.
Understanding what timing curves reveal requires correlating displacement anomalies with underlying mechanism conditions. Contact bounce patterns, prestrike signatures, and velocity irregularities each produce distinct waveform characteristics.
The displacement-time curve’s derivative reveals velocity characteristics critical for diagnosis. Closing velocity should fall within 0.4–1.2 m/s at contact touch for medium-voltage vacuum circuit breakers. Timing curves showing velocity outside this range indicate mechanism maladjustment requiring correction.
A sudden velocity reduction 5–10 mm before contact touch often indicates contaminated or damaged linkage pivot points. Conversely, velocity increase in this region suggests improper spring preload adjustment.
| Curve Anomaly | Primary Cause | Secondary Investigation |
|---|---|---|
| High-amplitude bounce (>4 mm) | Excessive closing velocity | Buffer damper condition |
| Extended bounce (>8 ms) | Worn contact materials | Wipe spring tension |
| Irregular bounce pattern | Linkage looseness | Shaft bearing condition |
| Extended prestrike (>2 ms) | Low closing velocity | Vacuum interrupter integrity |
| Velocity hesitation before touch | Contaminated linkage | Lubrication breakdown |
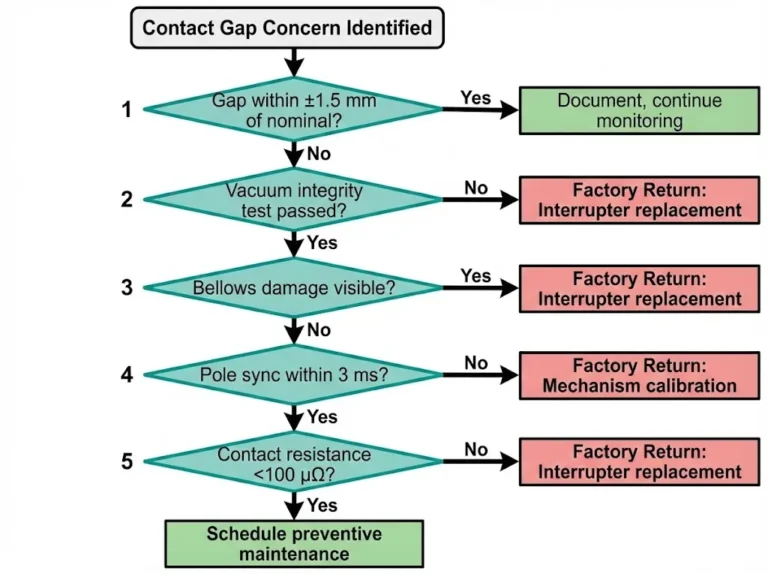
When prestrike occurs, the displacement gap at arc onset—measured directly from timing curves—indicates dielectric margin remaining in the vacuum interrupter. Gap measurements below 6 mm at prestrike onset suggest either excessive approach velocity allowing field concentration, or degraded vacuum conditions requiring X-ray or magnetron testing for confirmation [VERIFY STANDARD: IEC 62271-100 Annex E for vacuum integrity verification methods].
[Expert Insight: Field Diagnostic Priorities]
- Bounce duration trending provides earlier warning than contact resistance measurements
- Phase-to-phase timing deviation exceeding 3 ms often indicates individual pole mechanism wear rather than common drive issues
- Velocity profile changes of ±15% from baseline warrant immediate mechanism inspection regardless of bounce measurements
Achieving optimal closing speed requires balancing two competing requirements: sufficient momentum to overcome contact spring preload (typically 150–300 N) while minimizing rebound energy that drives bounce behavior.
The relationship follows the basic kinetic energy equation: Ekinetic = ½mv², where reducing velocity by 25% decreases rebound energy by approximately 44%. In practice, this means adjusting the mechanism’s closing spring preload from factory settings of 850 N down to 720–780 N when timing curves indicate excessive bounce.
Field experience with spring-operated mechanisms shows that closing velocities between 0.6–0.9 m/s produce bounce durations under 1.2 ms in properly adjusted units. When the moving contact assembly (typically 2–4 kg mass) impacts at velocities exceeding 1.2 m/s, bounce durations commonly extend beyond 2 ms.
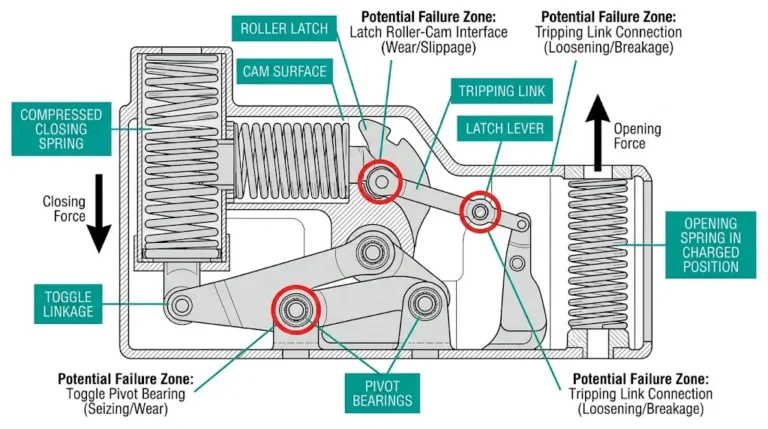
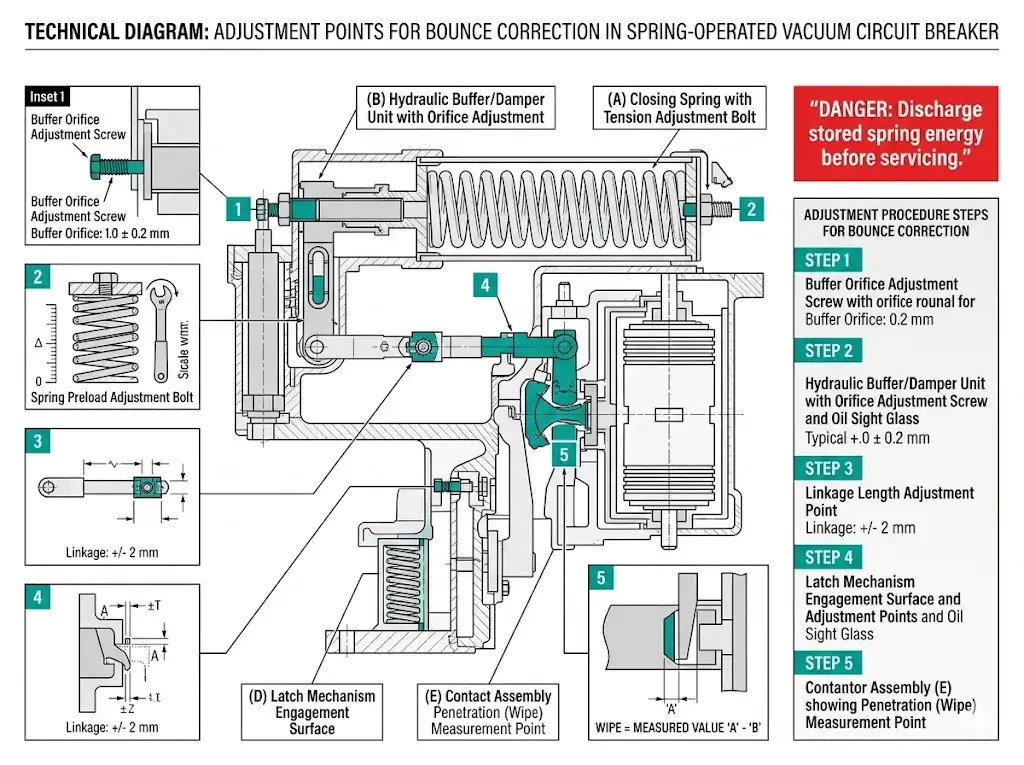
Closing speed adjustment typically involves modifying spring compression distance or hydraulic damper settings. The VS1 vacuum circuit breaker mechanism design illustrates typical adjustment points found in spring-operated medium-voltage breakers.
Step 1: Baseline Documentation
Record current timing curves across 5–10 operations before any adjustment. Note closing time, bounce duration, bounce count, and prestrike interval for each phase.
Step 2: Damper Adjustment
Increase hydraulic damper orifice restriction by 15–20% to extend deceleration time during the final 8–12 mm of travel. This reduces impact velocity without compromising minimum closing time requirements.
Step 3: Spring Preload Modification
If damper adjustment alone proves insufficient, reduce closing spring preload incrementally—typically 50 N steps—while monitoring that closing time remains within manufacturer specifications.
Step 4: Verification Testing
Perform minimum 10 closing operations after each adjustment. All three phases must achieve bounce duration below 2 ms simultaneously before returning the breaker to service.
Post-adjustment verification requires systematic testing beyond simple timing confirmation. The goal is ensuring mechanism stability across operating conditions while establishing updated baselines for future trending.
Following any mechanism adjustment:
Maintenance records should capture pre-adjustment timing curves, specific adjustments performed, post-adjustment verification data, and technician observations. This documentation enables trending analysis that predicts future maintenance requirements.
Environmental factors warrant particular attention. Mechanisms adjusted during summer months may exhibit different characteristics when temperatures drop. Facilities operating vacuum circuit breakers across wide temperature ranges should verify timing performance at seasonal extremes.
Timing curve interpretation requires both diagnostic equipment and engineering expertise to translate waveform patterns into effective corrective actions. XBRELE provides comprehensive support for vacuum circuit breaker mechanism analysis, from baseline commissioning tests through troubleshooting of complex timing anomalies.
Our engineering team offers timing curve review services, identifying root causes behind bounce and prestrike issues observed in field data. For mechanisms requiring component replacement, we supply factory-specification buffers, springs, linkage assemblies, and complete contact systems compatible with major manufacturer designs.
Contact XBRELE’s vacuum circuit breaker technical team for mechanism analysis consultation or replacement component specifications.
Q: What bounce duration indicates a vacuum circuit breaker needs mechanism adjustment?
A: Bounce duration consistently exceeding 2 ms across multiple test operations typically warrants mechanism inspection, though manufacturer specifications vary—some designs tolerate up to 3 ms before requiring corrective action.
Q: Does prestrike damage contacts even during normal operations?
A: Yes, prestrike arc erosion occurs during every energized closing operation regardless of mechanism condition, though properly tuned mechanisms minimize prestrike duration to reduce cumulative wear.
Q: How does ambient temperature affect timing curve measurements?
A: Temperature variations between –25°C and +40°C can shift closing time by 8–12% and alter bounce characteristics by 15–20% due to lubricant viscosity changes and spring rate variations.
Q: Can timing curves detect vacuum interrupter degradation?
A: Timing curves reveal indirect indicators—extended prestrike at lower voltages may suggest reduced vacuum integrity—but definitive vacuum assessment requires magnetron or X-ray testing methods.
Q: How frequently should timing curve analysis be performed?
A: Most maintenance programs specify timing tests every 2,000–5,000 operations or every 2–3 years, whichever occurs first, with more frequent testing for high-cycling applications like capacitor switching.
Q: What causes phase-to-phase timing deviation in three-phase breakers?
A: Deviation exceeding 2–3 ms between phases typically indicates individual pole mechanism wear, uneven spring tension, or linkage adjustment differences rather than common operating mechanism issues.
Q: Should timing curves be recorded at commissioning?
A: Baseline timing curves captured during commissioning provide essential reference data for future comparison, enabling detection of gradual mechanism degradation before parameters exceed acceptable limits.