Need Full Specifications?
Download our 2025 Product Catalog for detailed drawings and technical parameters of all switchgear components.
Get CatalogDownload our 2025 Product Catalog for detailed drawings and technical parameters of all switchgear components.
Get CatalogDownload our 2025 Product Catalog for detailed drawings and technical parameters of all switchgear components.
Get Catalog
Impedance percentage (Z%) appears on every transformer nameplate, yet many engineers treat it as a secondary specification. This single value—typically between 4% and 8% for distribution transformers—directly governs how much fault current flows during a short-circuit, how severely voltage sags under load, and whether parallel transformers share current properly or fight each other with damaging circulating currents.
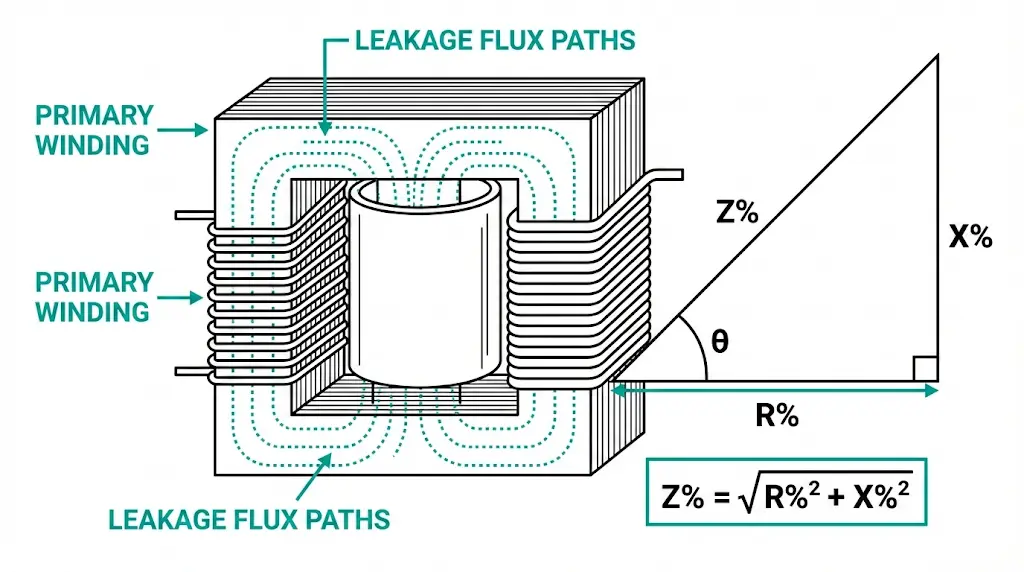
Z% represents the fraction of rated primary voltage required to circulate rated current through a short-circuited secondary winding. A 10 kV/0.4 kV transformer with 6% impedance needs 600 V applied to its primary terminals to force full-load current through the shorted secondary. This measurement captures the combined opposition from winding resistance and magnetic flux leakage—the two physical phenomena that limit current flow in every transformer.
Understanding what this percentage physically represents transforms Z% from an abstract nameplate value into a design variable you control.
Transformer impedance comprises two distinct components working in vector combination. Resistance (R%) represents copper losses in the windings—the I²R heating that occurs whenever current flows through conductors. For distribution transformers, R% typically contributes 5–15% of total impedance, varying with conductor material (copper versus aluminum) and winding geometry.
Reactance (X%) dominates in transformers above 500 kVA, typically comprising 85–95% of total impedance. This component arises from magnetic flux produced by one winding that fails to couple with the other winding. Instead of transferring energy, this “leakage flux” creates self-inductance that opposes current changes.
The impedance relationship follows: Z% = √(R%² + X%²), where Z% is expressed as a percentage of rated voltage. For a 1,600 kVA distribution transformer with Z% = 6%, applying 6% of rated primary voltage (e.g., 600 V on a 10 kV primary) drives full-load current through the secondary when short-circuited.
Manufacturers adjust X% by modifying the radial spacing between winding layers. Increasing separation raises leakage reactance—and therefore Z%—which limits fault current but increases voltage drop under load. This fundamental trade-off shapes every transformer design decision.
According to IEC 60076-1, manufacturers must declare impedance values with a tolerance of ±10% for two-winding transformers. This standardization ensures protection coordination calculations remain valid across different suppliers, though engineers specifying transformers for parallel operation should request tighter tolerances.
[Expert Insight: Field Observations on Impedance Components]
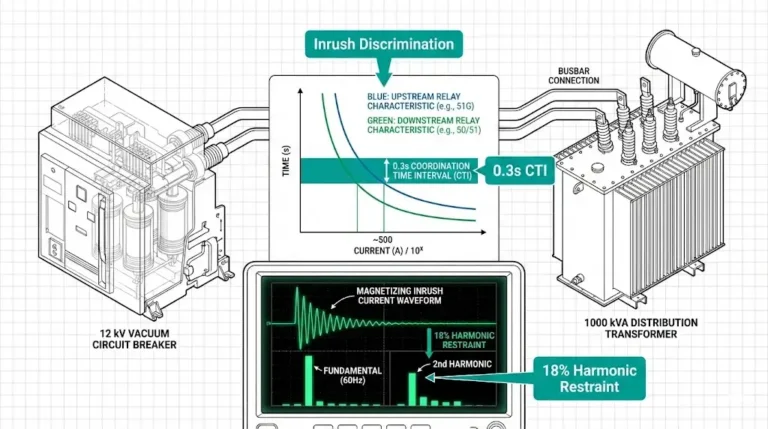
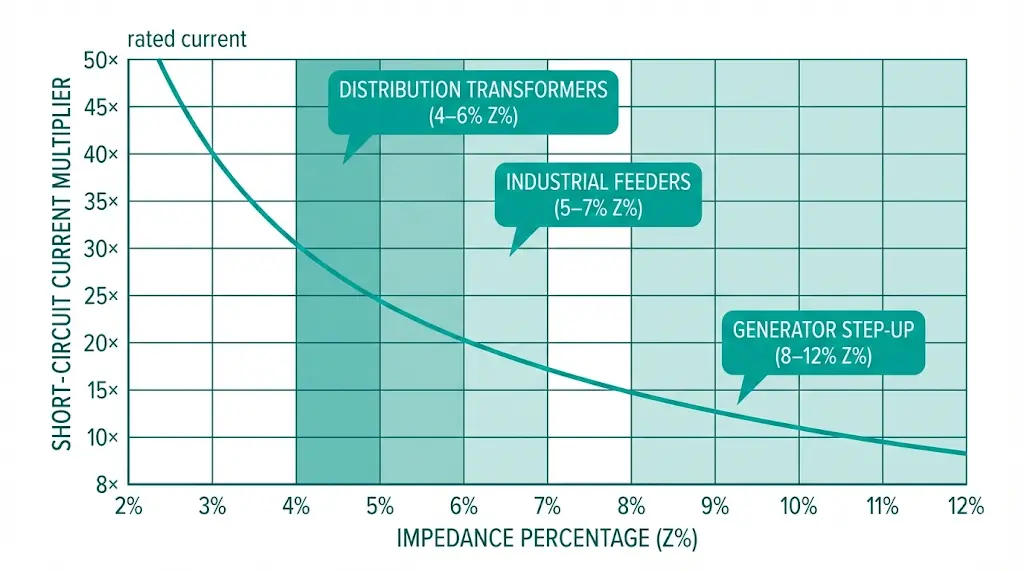
Transformer impedance directly determines the maximum fault current that can flow during a short-circuit. This inverse relationship forms the foundation of protection system coordination: lower Z% means higher fault current, demanding more robust switchgear and cables.
During a bolted fault at the secondary terminals, only the transformer’s internal impedance limits current flow. The calculation follows straightforward physics.
Short-circuit current formula: Isc = (S × 100) ÷ (√3 × UL × Z%)
Where S = transformer rating (kVA), UL = line voltage (V), Z% = percent impedance
For a 2500 kVA, 20/0.4 kV transformer with Z% = 6.25%:
This 57.7 kA fault current determines circuit breaker breaking capacity, busbar bracing requirements, and cable short-circuit ratings. A transformer with 4% impedance would produce 90 kA under identical conditions—demanding significantly more expensive protection equipment.
The infinite bus assumption—treating the upstream supply as having zero impedance—provides conservative worst-case values. Real installations have finite source impedance from utility transformers, cables, and network configuration. Including source impedance reduces calculated fault levels:
Z_total% = Z_source% + Z_transformer%
For a 2 MVA transformer on a 250 MVA source, the source contributes only 0.8% equivalent impedance (2/250 × 100). Combined with 6% transformer impedance, total Z% becomes 6.8%—reducing fault current by approximately 12% compared to the infinite bus calculation.
[VERIFY STANDARD: IEC 60909 provides detailed methodology for short-circuit calculations including correction factors for generator contributions and temperature effects]
IEC 60076-5 requires oil-immersed transformers to withstand symmetrical short-circuit currents for 2 seconds without damage. Peak asymmetrical current—typically 2.5 times the symmetrical value—determines dynamic withstand requirements for busbars and circuit breaker making capacity. When specifying protection equipment to coordinate with calculated fault levels, refer to manufacturer guidance for vacuum circuit breakers.
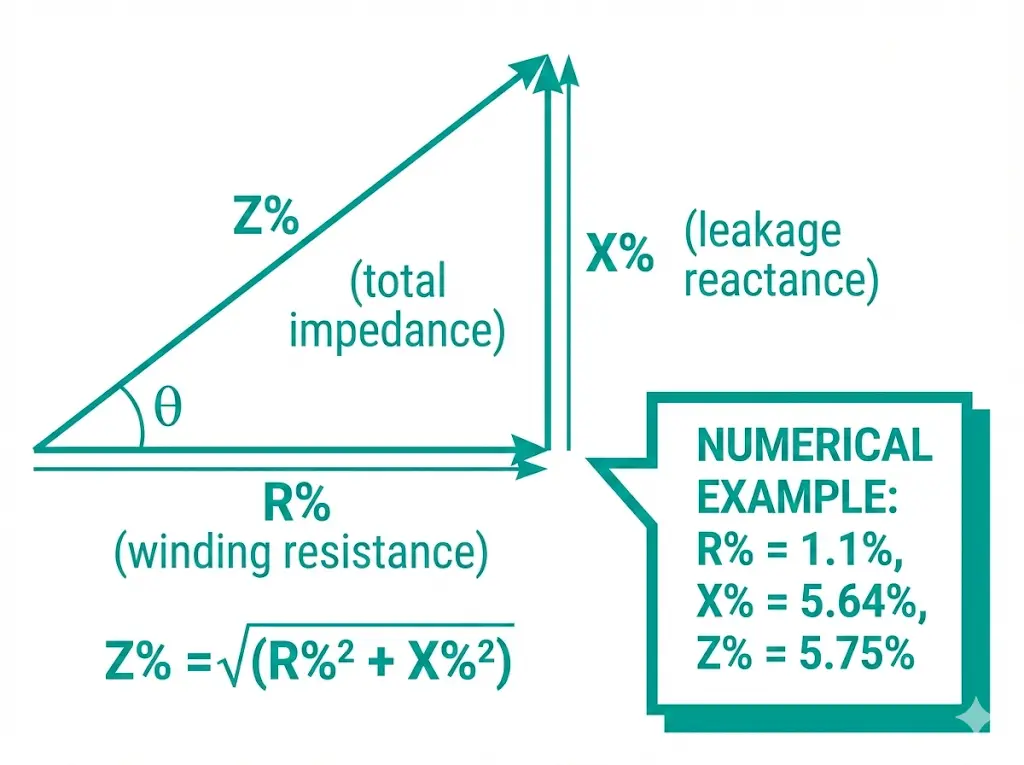
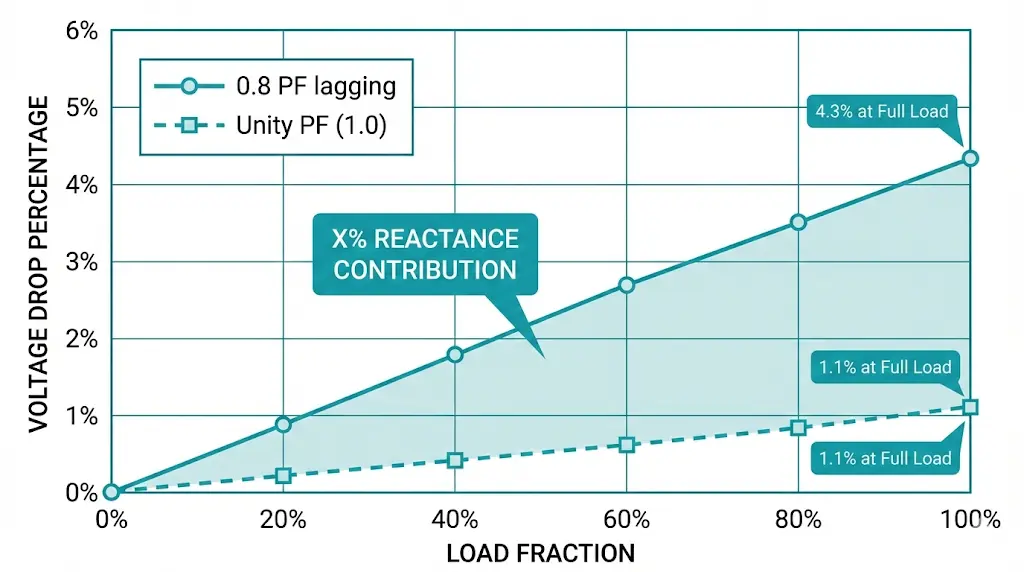
Higher impedance causes greater voltage sag during load surges—a critical concern for installations with motor starting requirements or sensitive electronic loads. The voltage drop calculation reveals why power factor dramatically affects performance.
ΔV% ≈ (Load fraction) × [R% × cos(φ) + X% × sin(φ)]
For a 1,000 kVA transformer with R% = 1.1% and X% = 5.64% (total Z% = 5.75%), voltage drop at full load varies dramatically with power factor:
At 0.8 power factor lagging: ΔV% = 1.0 × [1.1 × 0.8 + 5.64 × 0.6] = 4.26%
At unity power factor: ΔV% = 1.0 × [1.1 × 1.0 + 5.64 × 0] = 1.1%
This fourfold difference explains why power factor correction capacitors improve voltage profiles. They shift the current angle, reducing the dominant X% contribution to voltage drop.
Voltage regulation—the change from no-load to full-load voltage expressed as a percentage—directly reflects impedance characteristics. Lower Z% delivers tighter regulation but permits higher fault currents. The application determines optimal balance:
| Application | Typical Z% | Selection Rationale |
|---|---|---|
| Urban distribution | 4–6% | Voltage quality priority, adequate fault limiting |
| Industrial feeders | 5–7% | Motor starting tolerance, higher fault limiting |
| Generator step-up | 8–12% | Limit generator fault contribution |
| Arc furnace supply | 10–15% | Control current fluctuation magnitude |
For comprehensive guidance on transformer specification and procurement, including impedance selection for specific applications, see the XBRELE engineering portal.
[Expert Insight: Voltage Regulation Field Experience]
Substation load growth often exceeds single-transformer capacity. Rather than replacing a working unit, engineers add a second transformer in parallel—gaining redundancy, improved partial-load efficiency, and staged capital investment. However, parallel operation demands matched characteristics to prevent circulating currents.
Four conditions must be satisfied:
1. Identical Voltage Ratio: A 0.5% difference in turns ratio creates circulating current equal to the mismatch divided by the sum of impedances. For two 5% impedance transformers with 0.5% ratio difference: I_circ = 0.5% / (5% + 5%) = 5% of rated current—flowing continuously, adding losses, reducing available capacity.
2. Same Vector Group: Transformers must share identical phase displacement (Dyn11 with Dyn11, not Dyn11 with Dyn1). Mismatched vector groups create phase shifts that can produce circulating currents exceeding rated current.
3. Matched Impedance Percentage: Parallel transformers share load inversely proportional to their impedances. Two 1,000 kVA transformers with Z% = 4% and Z% = 6% sharing a 2,000 kVA load:
The 4% unit overloads before combined capacity is utilized. Industry guidelines recommend matching impedance within ±10% for satisfactory parallel operation.
4. Correct Polarity: Wrong polarity creates a dead short through the parallel path at energization.
When procuring replacement transformers for existing parallel banks, specify the target impedance with explicit tolerance. Request factory test verification before shipping, and confirm actual measured Z% values before paralleling. For related switching technology used in transformer protection circuits, see the XBRELE technical knowledge base.
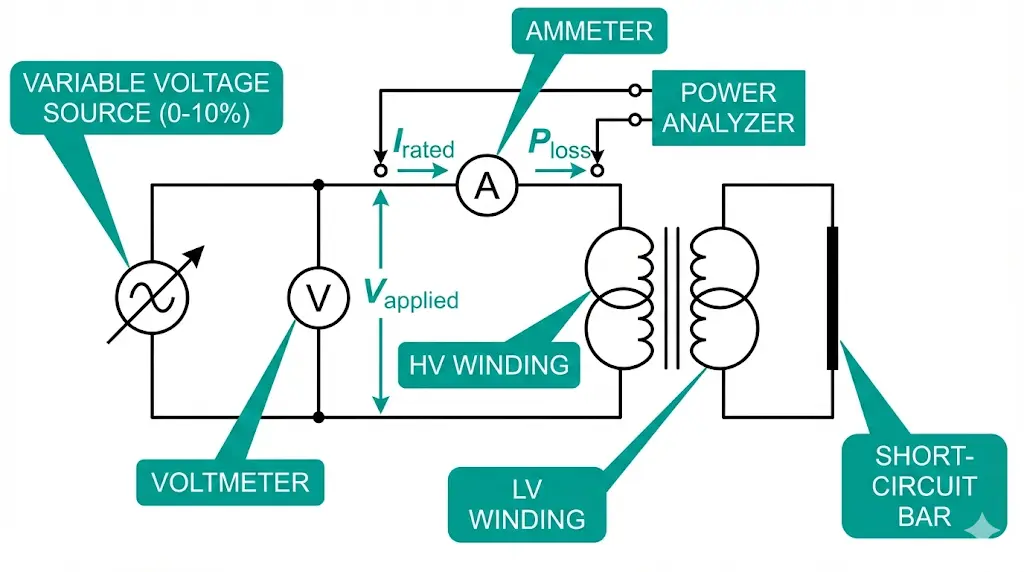
The standard factory test for determining Z% applies reduced voltage to one winding while short-circuiting the other. This short-circuit test procedure follows IEC 60076-1 requirements:
The impedance voltage (V_z) as a percentage of rated voltage equals Z%. Power measured represents load losses—the I²R heating in both windings that determines efficiency under load.
Temperature correction is essential for accurate comparison with nameplate values. Resistance changes with conductor temperature, requiring adjustment to reference conditions:
Rcorrected = Rmeasured × [(235 + Tref) / (235 + Tmeasured)]Reference temperatures: 75°C (IEC standards), 85°C (IEEE standards)
Reactance remains essentially constant with temperature, so only the R% component requires adjustment. For transformers destined for parallel operation, compare measured Z% values between units before energizing in parallel—nameplate tolerances may result in actual mismatches exceeding acceptable limits.
Documentation of measured impedance values provides essential reference data for future protection coordination studies and replacement transformer specifications. For switchgear components that protect transformer installations, see the XBRELE technical catalog.
The Z% decision balances competing requirements. Lower impedance improves voltage regulation and motor starting capability but increases fault current—demanding more expensive protection equipment. Higher impedance limits fault energy but causes greater voltage fluctuations under dynamic loads.
Decision framework:
| Priority | Recommended Z% | Typical Applications |
|---|---|---|
| Voltage regulation | 4–5% | Data centers, semiconductor facilities, precision manufacturing |
| Fault current limiting | 6–8% | Urban substations, retrofit installations with limited breaker ratings |
| Motor starting | 4–5% | Industrial plants with large induction motors, mining operations |
| Parallel operation | Match existing ±10% | Capacity expansion, redundancy upgrades |
Requesting non-standard impedance typically adds 3–8% to unit cost. Manufacturers modify winding spacing and conductor arrangement to achieve specified values—confirm capability before finalizing procurement specifications.
For engineered transformer solutions with specified impedance matching, contact XBRELE’s technical team through the transformer specification and procurement portal.
Q: How do you calculate short-circuit current from transformer impedance? A: Divide 100 by the impedance percentage, then multiply by the transformer’s rated secondary current. A 1,000 kVA, 400 V secondary transformer with 5% impedance produces approximately 28.9 kA symmetrical fault current (1,443 A × 20).
Q: What happens when parallel transformers have different impedance values? A: The lower-impedance unit carries disproportionately more load, potentially reaching overload before the combined bank capacity is utilized. A 10% impedance difference typically causes 5–8% load imbalance between units.
Q: Why does power factor affect voltage drop more than impedance percentage alone suggests? A: The reactive component (X%) multiplies with sin(φ) in the voltage drop equation. At 0.8 power factor lagging, X% contributes roughly three times more to voltage drop than at unity power factor, where only the smaller R% component affects regulation.
Q: Can manufacturers build transformers with custom impedance values? A: Yes, impedance is adjusted through winding geometry—specifically the radial spacing between primary and secondary coils. Custom Z% values within physical limits typically add 3–8% to unit cost and require design verification before production.
Q: How does temperature affect measured impedance during field testing? A: Only the resistive component changes with temperature; reactance remains constant. Copper resistance increases approximately 0.4% per degree Celsius, requiring correction to 75°C (IEC) or 85°C (IEEE) reference for accurate nameplate comparison.
Q: What impedance tolerance should be specified for parallel operation? A: Request ±5% tolerance when ordering transformers intended for parallel banks. Standard manufacturing tolerance of ±10% may result in actual impedance differences exceeding the recommended 10% matching limit between units.
Q: Does higher impedance always mean better fault protection? A: Higher Z% reduces fault current magnitude but increases voltage drop during load surges and motor starting. The optimal value depends on whether fault limiting or voltage regulation takes priority for the specific installation.